Back to article: Trehalose-6-phosphate promotes fermentation and glucose repression in Saccharomyces cerevisiae
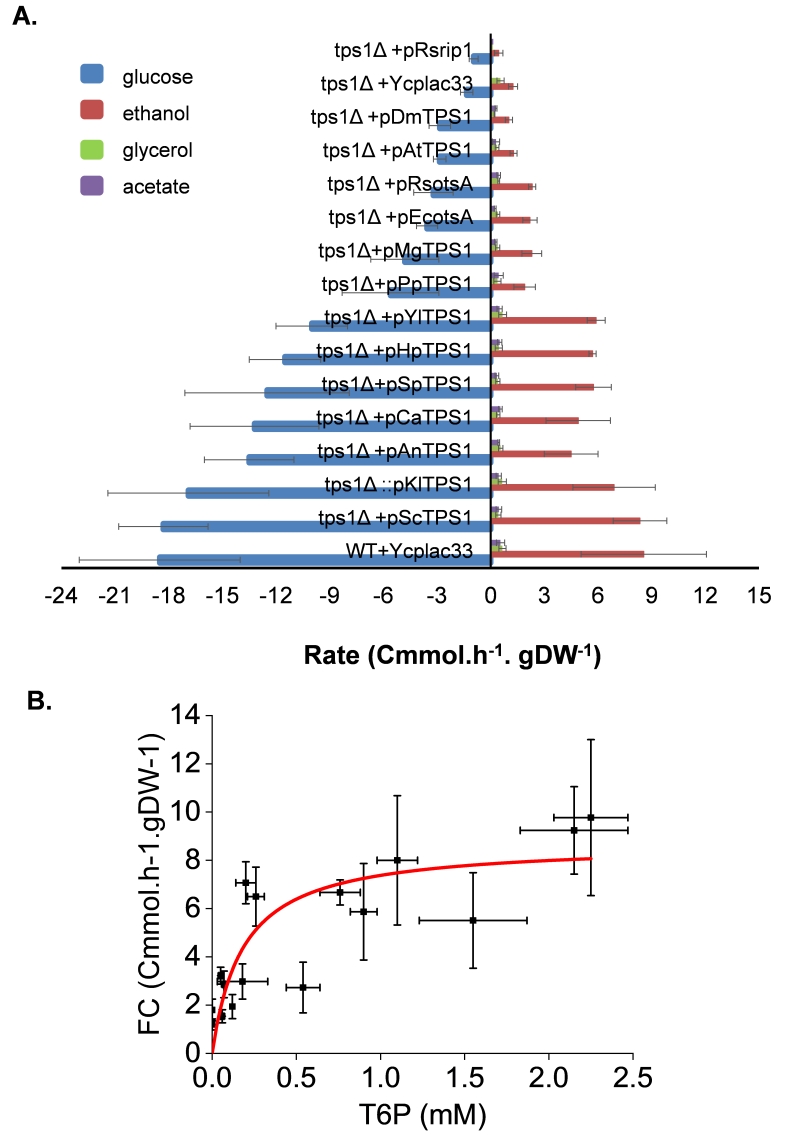
FIGURE 7: Determination of the fermentation capacity of S. cerevisiae tps1 mutant complemented with TPS1 from different origins. The experimental design was as described in Fig.3 except that the supernatants of the cultures were taken at 5 min interval after glucose addition for 60 min. Exo-metabolites determined by HPLC were expressed as Cmmol consumed (glucose) or produced (ethanol, ace-tate and glycerol) per h-1 and per g DCW-1. Results shown are the mean of three independ-ent experiments with standard deviation bars (A). In (B), Relationship between fermentation capacity (FC) and T6P level. The Origin 2018 software (OriginLab, https://www.originlab.com/) was used to fit the data using the non-iterative fitting algorithm (Levenberg-Marquardt) selecting for the Michaelis-Menten or Hill models defined in the software.

