
Back to article: A humanized yeast-based toolkit for monitoring phosphatidylinositol 3-kinase activity at both single cell and population levels
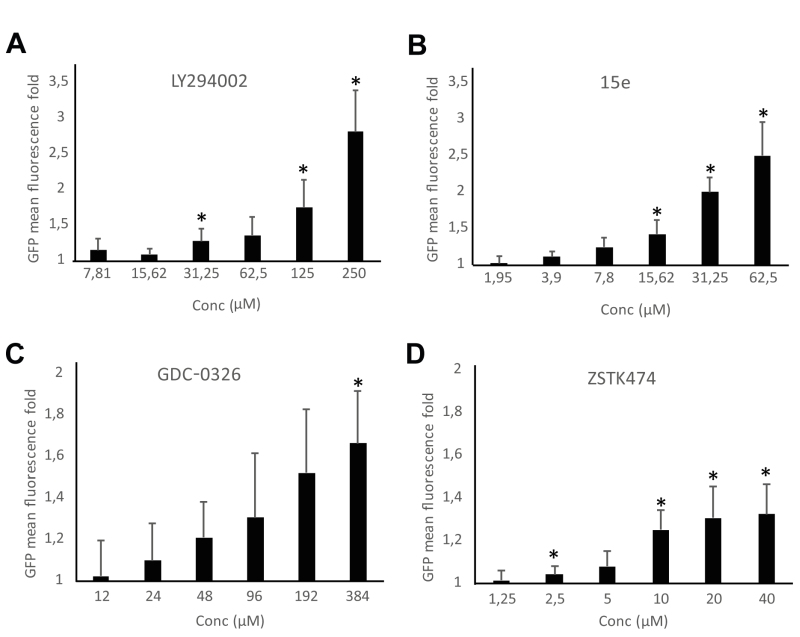
FIGURE 5: Dose-response graphs showing enhancement of fluorescence by the FLUPI assay. Triple pJMCS-LG3, pGNG1 and YCpLG-p110α YPH499 transformants were analyzed by flow cytometry as in Fig. 4B in the presence of different doses of inhibitors as noted. The abscissae represent fold increase in green fluorescence of treated samples with the indicated concentrations of compounds LY294002 (A), 15e (B), GDC-0326 (C) and ZSTK474 (D) relative to their correspondent DMSO alone control (normalized to 1). Three different clones were analyzed per experiment (n = 10,000 cells per clone). Data correspond to the average, and error bars represent SD. Asterisks (*) mark data points that are statistically significant respective to the data of the lowest concentration of compound tested in each series, according to Student´s t-test (p < 0.05).