
Back to article: Guidelines for DNA recombination and repair studies: Cellular assays of DNA repair pathways
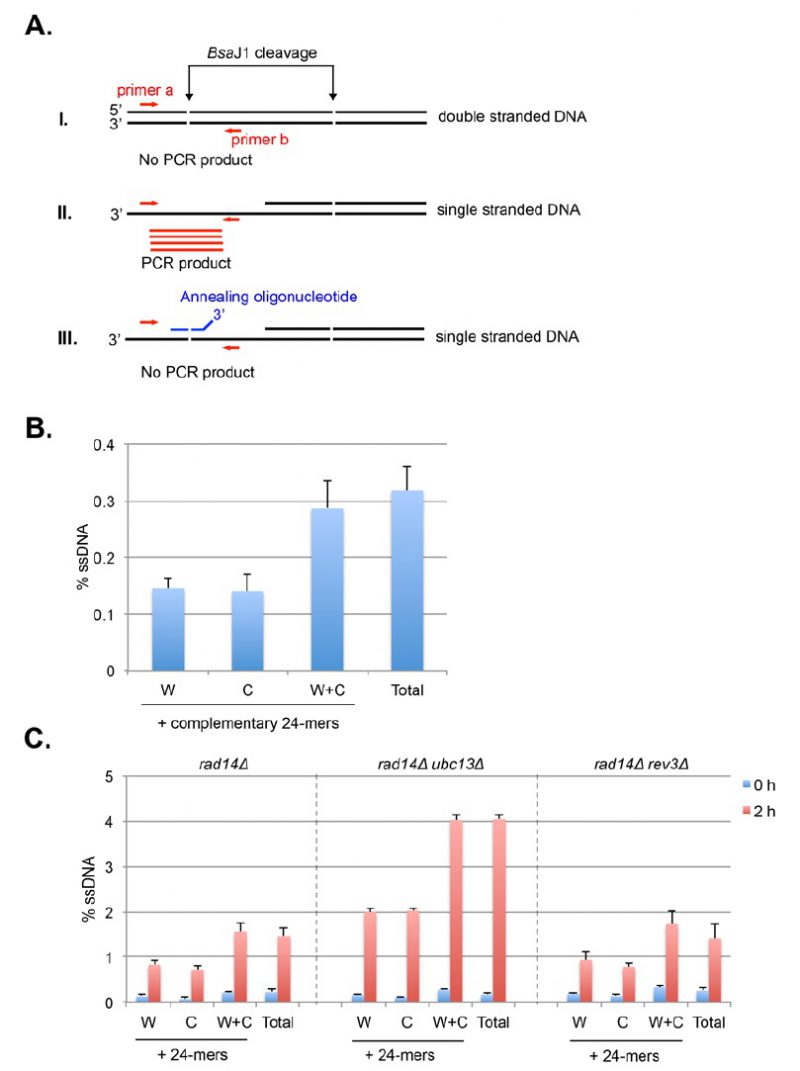
FIGURE 11: Schematic principles and determination of strand-specific ssDNA detection by restriction enzyme digestion and real-time PCR. (A) Detection of strand-specific ssDNA by real time PCR. i. Duplex DNA molecule is digested by BsaJ1 restriction enzyme. No PCR product will be generated using primers (a and b, red arrows) flanking the restriction enzyme recognition site; ii. ssDNA is resistant to enzyme cleavage and permits the formation of PCR products (red lines) flanking the restriction site using a set of primers (red arrows); iii. Addition of complementary oligonucleotides with 4 nucleotide mismatches at the 3′ end (blue broken line) renders ssDNA cleaved by BsaJ1 and suppresses the formation of PCR products. (B) The level of total and strand-specific ssDNA at 2.1-kb right distal to the origin ARS305 in the genomic DNA isolated from G1-arrested RAD14+ cells. 24-mer complementary oligonucleotides to Watson or Crick strands were added to determine strand-specificity of ssDNA. Percent ssDNA (% ssDNA) is calculated using the formula: %ssDNA= 200×2Δct / (1+2Δct) % wherein Δct = ctcontrol-ctBsaJ1+PEadj. ctBsaJ1 is the ct value at the BsaJ1 site that is 2.1 kb distal to ARS305. ctcontrol is the ct value at the locus 0.9-kb right distal to ARS305, a control locus that does not contain a BsaJ1 restriction site; PEadj is a constant value adjusting the PCR efficiency difference between the primer sets for 0.9-kb and 2.1-kb, which equals ct2.1k-ct0.9k using undigested genomic DNA as the PCR template. The results are the average of three independent experiments