
Back to article: Guidelines for DNA recombination and repair studies: Cellular assays of DNA repair pathways
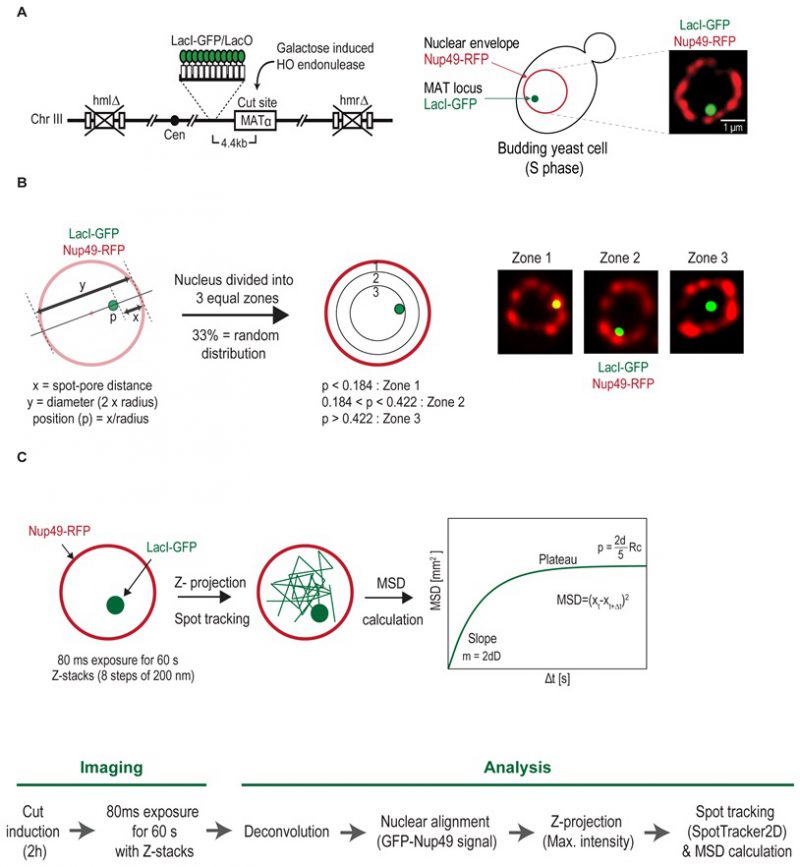
FIGURE 17: Visualizing chromosomal dynamics at a DNA DSB in the yeast S. cerevisiae. (A) Schematic representation of the chromosomal locus tagging system. HO endonuclease is used to generate a single DSB at the mating type locus (MAT locus) that is tagged with a lacO array. The LacO array binds the LacI repressor fused to a green fluorescent protein (LacI-GFP). The nuclear envelope is visualized using a fluorescently tagged nuclear pore protein (Nup49-RFP). (B) Analyzing chromosomal locus position. Relative locus position (p) is calculated by normalizing the distance pore-locus (x) by the nuclear radius (y/2). The radial distances are then classified into three groups – Zone 1 (peripheral width=0.184 x nuclear radius(r)), 2 (middle width between 0.185r and 0.422r) and 3 (central width=0.578r) – of equal surface. (C) Analyzing chromosomal locus mobility. Overview of the imaging procedure. Single cell, multi-stack images are acquired every 80 ms for 60 s. After deconvolution and nuclear alignment, the 3D images are converted to 2D using a maximum z-projection. The tagged locus is tracked using SpotTracker2D and an absolute MSD calculation is applied.