
Back to article: Guidelines for DNA recombination and repair studies: Mechanistic assays of DNA repair processes
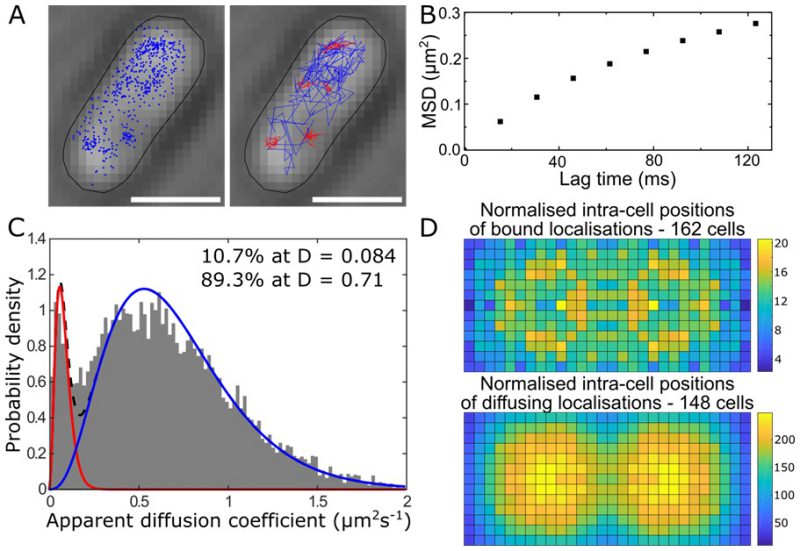
FIGURE 7: PALM imaging. Tracking PALM experiment with DNA polymerase I-PAmCherry fusions in E. coli, performed 30 min following treatment with 100 mM MMS. (A) Bright-field image of a single E. coli cell superimposed with the detected cell boundary mesh, molecular localizations (left), and compiled molecular tracks (right). Scale bars, 1 µm. (B) Mean MSD analysis obtained for 2,048 molecular tracks. (C) Apparent diffusion coefficient histogram from 2,048 molecules, calculated from MSDs; the inset numbers indicate the proportion of molecules in each population. (D) Heat maps of molecular localizations for the bound (top), and freely-diffusing (bottom) populations.