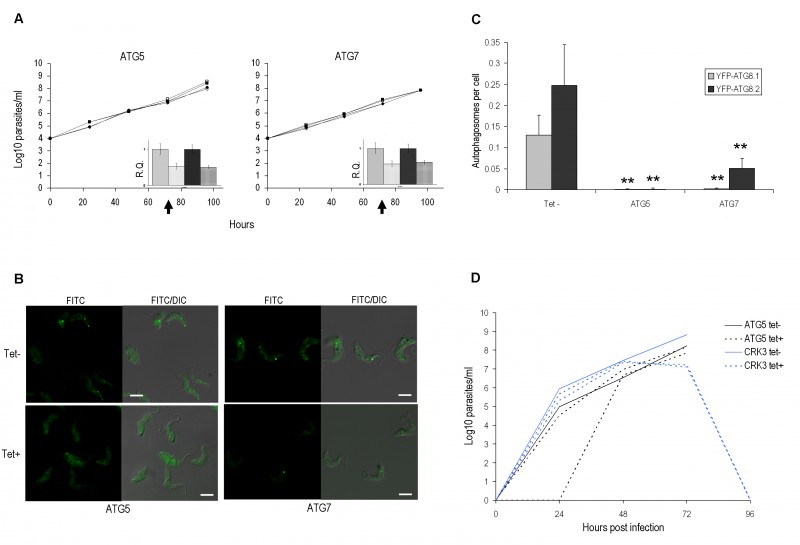
FIGURE 3: RNAi of autophagy genes in bloodstream form.
(A) Growth analysis of BSF RNAi mutants in vitro. RNAi of ATG5 and ATG7 genes in BSF 2T1 constitutively expressing YFP-ATG8.1 (diamonds) and YFP-ATG8.2 (squares). RNAi induced with tetracycline (filled symbols) and growth compared to controls (empty symbols) for 96 h. Cells were re-seeded to 1 x 10⁴ ml-1 at 48 h as required, with cumulative values shown. Arrows indicate time point selected for microscopy analysis. Inset: qPCR of ATG5 or ATG7 cell lines 72 h after tetracy-cline induction (hatch) or control in BSF 2T1 clones expressing either YFP-ATG8.1 (grey) or YFP-ATG8.2 (black). Error bars represent one standard deviation derived from three replicates.
(B) RNAi depletion of ATG genes influences autophagy. Constitutive expression of YFP-ATG8.1 and YFP-ATG8.2 in BSF 2T1 cells was visualised by fluorescent microscopy following individual RNAi of ATG5 and ATG7. Left hand images FITC filter set, right hand images FITC DIC merge. Scale bar 5 µm.
(C) The mean number of autophagosomes per cell was determined in ATG5 and ATG7 RNAi lines by counting >200 cells 72 h after induction, with data displayed as a mean of three replicate experiments. Error bars represent standard deviation and asterisks indicate where data differed significantly from the mean of the un-induced controls **p<0.01.
(D) Growth analysis of BSF ATG5 and CRK3 RNAi mutants in vivo. 1 x 10⁵ (ATG5) and 5 x 10⁵ (CRK3) trypanosomes were inoculated in 3 mice and RNAi induced with doxycycline (Dox) in 2 mice 24 h (ATG5) or 48 h (CRK3) later. Parasitaemia was monitored by tail bleed and counting on a haemocytometer.

