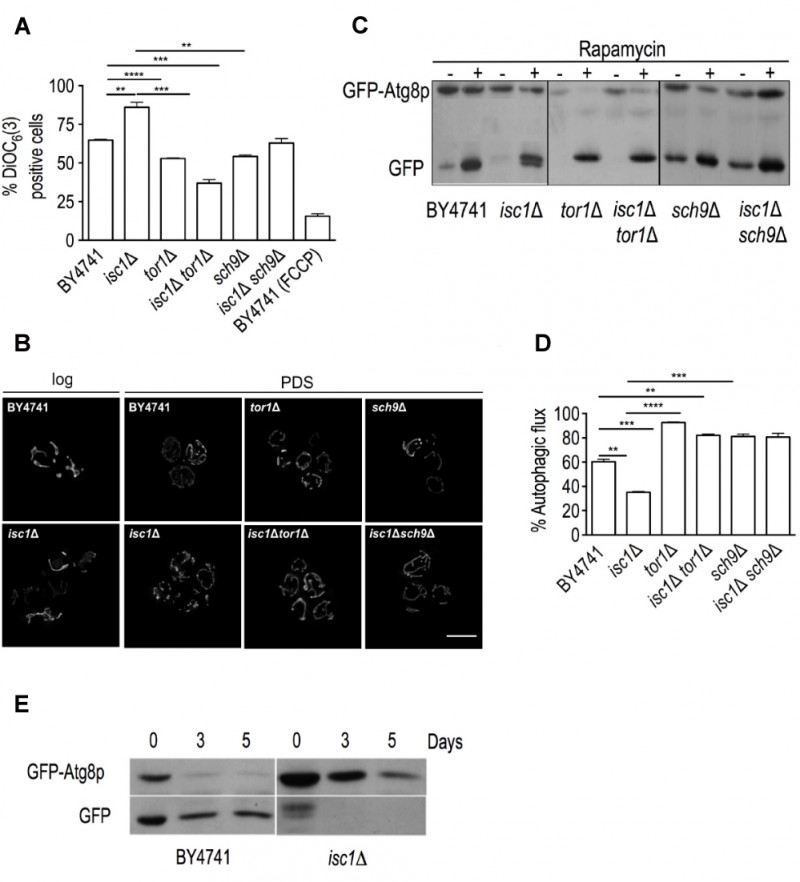
FIGURE 4: The mitochondrial membrane hyperpolarization and decreased autophagic flux contribute to mitochondrial dysfunction and impairment of mitochondrial dynamics in isc1Δ cells.
(A) S. cerevisiae BY4741, isc1Δ, tor1Δ and isc1Δtor1Δ, sch9Δ and isc1Δsch9Δ cells were grown in SC-medium to the PDS phase, stained with the potential-sensitive dye 3,3-dihexyloxacarbocyanine iodide [DiOC6(3)] for 30 min and analyzed by flow cytometry. Treatment of the parental strain (BY4741) with FCCP (carbonyl cyanide 4-(trifluoromethoxy)phenylhydrazone) was used as a positive control (depolarizing event). Values are mean ± SD of at least three independent experiments. ****p<0.0001; ***p<0.001; **p<0.01.
(B) Yeast cells transformed with pYX222-mtDsRed were grown to the exponential and PDS phases and analyzed by fluorescence microscopy, as described in Materials and Methods. Live cells were visualized by fluorescence microscopy. A representative experiment out of three is shown. Scale bar: 5 µm.
(C) S. cerevisiae BY4741, isc1Δ, tor1Δ and isc1Δtor1Δ, sch9Δ and isc1Δsch9Δ cells carrying pRS416 GFP-ATG8 were grown to the exponential phase in SC-medium and treated with either rapamycin (200 ng/mL) or DMSO (vehicle) for 3 hours. Proteins were analyzed by immunoblotting, using anti-GFP antibody.
(D) The autophagic flux was calculated by the ratio between the free GFP signal and the sum of free GFP and GFP-Atg8p signals. Values are mean ± SD of at least three independent experiments ****p<0.0001; ***p<0.001; **p<0.01.
(E) S. cerevisiae BY4741 and isc1Δ cells carrying pRS416 GFP-ATG8 were grown to PDS phase, washed twice with water and then maintained in water. Proteins were analyzed by immunoblotting, using anti-GFP antibody.

