
Back to article: Predictable regulation of survival by intratumoral microbe-immune crosstalk in patients with lung adenocarcinoma
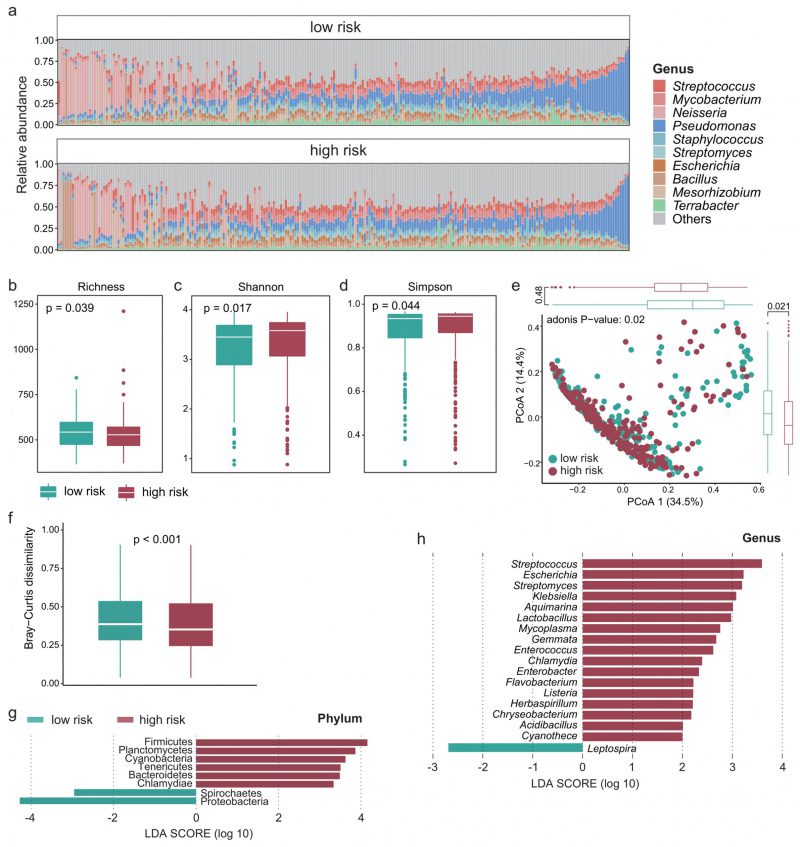
FIGURE 4: The intratumoral microbial profile was significantly different between the high- and low-risk group. (A) Relative abundance of the intratumoral microbes at the genus level in each patient. Boxplot showing the difference in (B) microbial richness, (C) the Shannon and (D) Simpson indices between the high- and low-risk group. Wilcoxon test was used to perform the statistical test. (E) PCoA based on the Bray-Curtis dissimilarity matrix showing the difference in intratumoral microbial community composition between the high- and low-risk group. (F) Boxplot showing the difference in Bray-Curtis dissimilarity index between the high- and low-risk group. Significantly different microbes in abundance between the high- and low-risk group at the (G) phylum and (H) genus level.