
Back to article: A cobalt concentration sensitive Btu-like system facilitates cobalamin uptake in Anabaena sp. PCC 7120
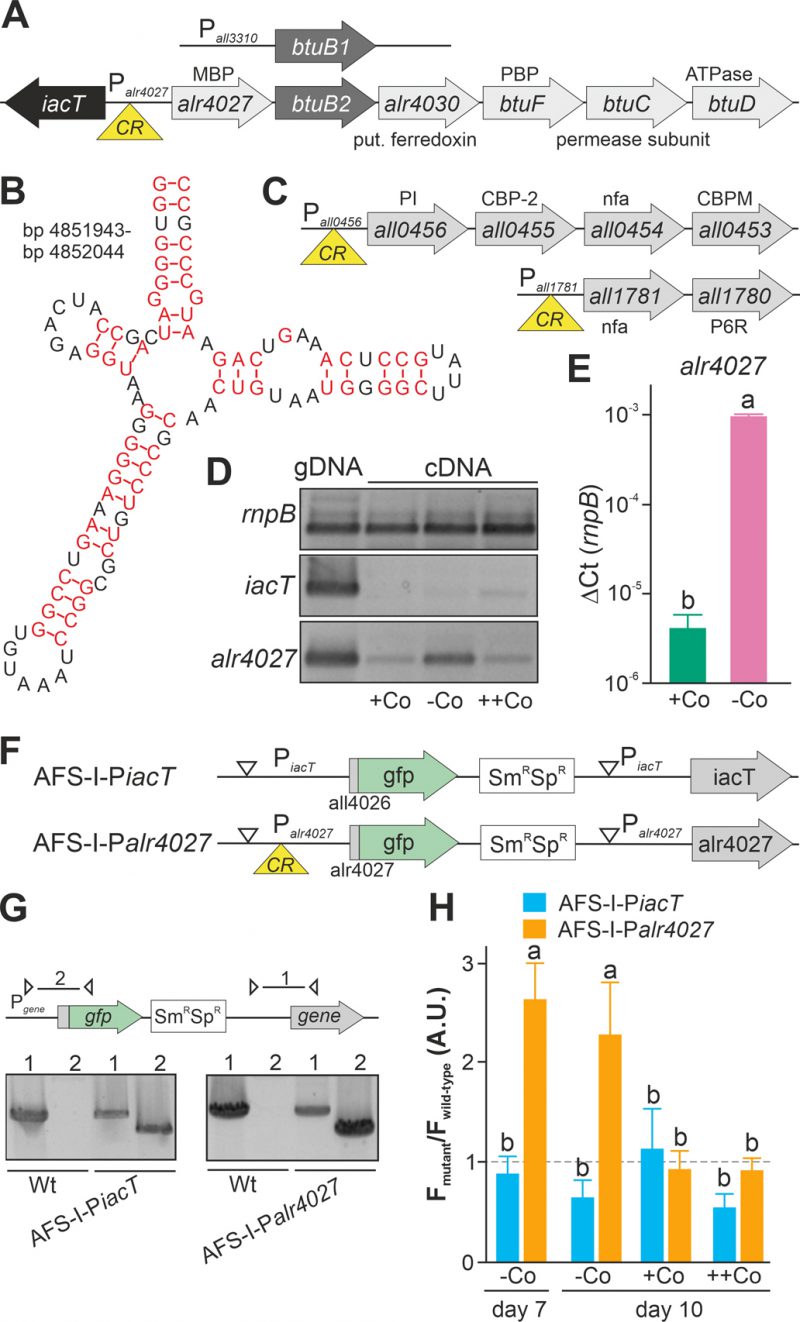
FIGURE 1. Regulation of translation by a cobalamin riboswitch. (A) Genomic organization of the region containing btuB1 and btuB2. Yellow triangle marks the riboswitch position. CR: cyanocobalamin riboswitch; MBP: metal-binding protein; PBP: periplasmic binding protein. (B) Predicted structure of the adenosylcobalamin riboswitch encoded in the 5' region of alr4027. (C) Genomic organization of two gene clusters with identified cyanocobalamin riboswitch. CBP-2: cobalamin biosynthesis precorrin-2; CBPM: cobalamin biosynthesis precorrin-3 methylase; nfa: no functional assignment; P6R: precorrin-6x reductase; PI: precorrin isomerase. (D) gDNA (lane 1) and cDNA (lane 2-4) of Anabaena grown for 14 days in YBG11 medium without cobalt and subsequently grown for seven days in YBG11 (+Co, lane 2), in YBG11 without cobalt (-Co, lane 1 and 3) or YBG11 with 5 µM CoCl2 (++Co, lane 4) media was analyzed by PCR using oligonucleotides for the indicated genes. (E) The cDNA (+Co, -Co) used in D was analyzed by qPCR and values were normalized to the level of rnpB. (F) Model of the strategy for genomic plasmid insertion to generate AFS-I-PiacT and AFS-I-Palr4027. (G) Genomic DNA isolated from wild-type Anabaena, AFS-I-PiacT and AFS-I-Palr4027 was used for PCR with gene-specific primers (lane 1) or a plasmid- and a gene-specific primer (lane 2) as indicated in the model on top. (H) Wild-type Anabaena, AFS-I-PiacT (blue) and AFS-I-Palr4027 (orange) were grown in YBG11 medium without cobalt for seven (first bar) or ten days (second bar). After seven days the culture was transferred into a new medium for growth for three days in YBG11 (+Co, third bar) or in YBG11 with 5 µM CoCl2 (++Co, fourth bar) media. The ratio of the GFP fluorescence of the mutant strain and the background in wild-type Anabaena is shown and the background level is indicated as a dashed line. In (E) and (H) the results represent the average of at least three independent experiments; error bars show standard deviation and letters indicate the ranks based on statistical analysis performed using ANOVA (p<0.05).