
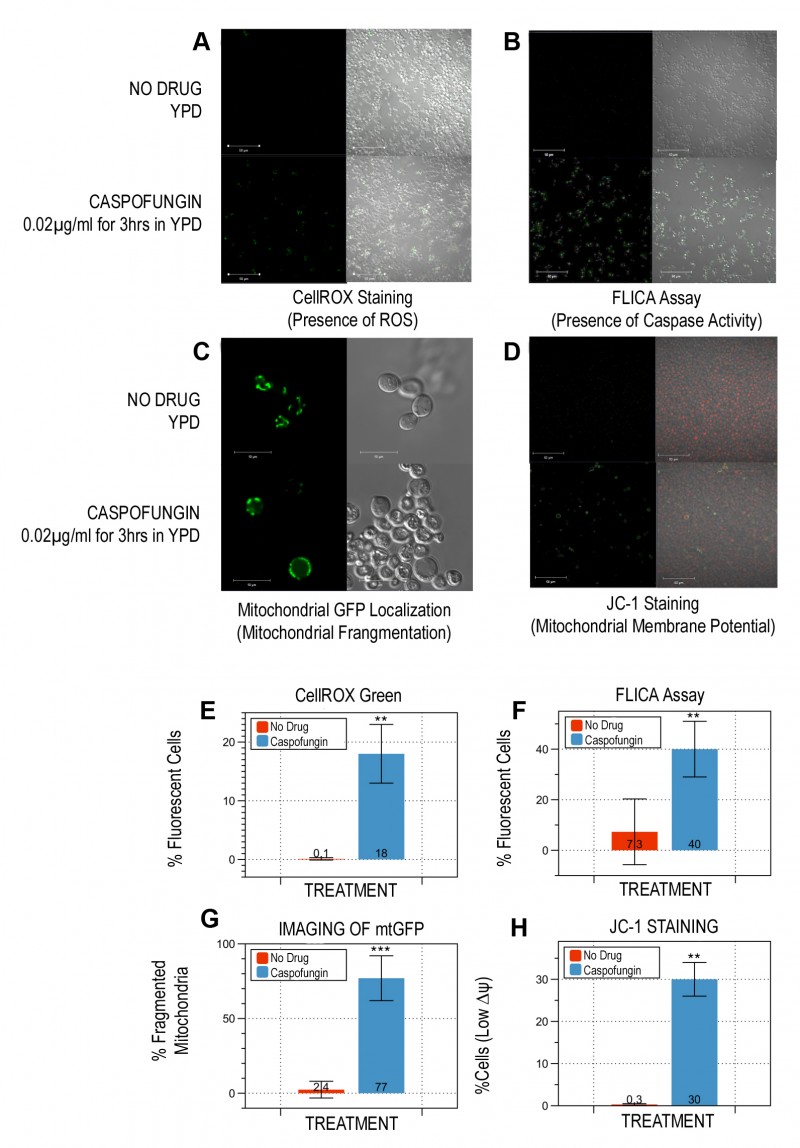
FIGURE 1: Saccharomyces cerevisiae cells cultured in caspofungin manifest numerous phenotypic markers associated with yeast programmed cell death.
Exponentially-growing wildtype cells from the W303-1A strain background were cultured in YPD containing 0.02µg/ml caspofungin for three hours. The cells were stained with 2.5µM CellROX Green to detect ROS (A, E); with a FLICA kit to detect activated caspase activity (B, F); and with the mitochondrial vital dye, JC-1, to assess their mitochondrial membrane potential (D, H). To visualize the structure of their mitochondria, the cells were transformed with a p416 GPD-mtGFP plasmid constitutively expressing a mitochondria-localized GFP marker and their mitochondria were visualized after they had been treated with caspofungin as described above (C, G). Representative images are shown (A-D). Statistical significance for the graphs (E-H) was determined with the unpaired Student’s t-test (**: p<0.05; ***: p<0.005), and a minimum of 500 cells was counted for each assay.