
Back to article: Quantifying yeast lipidomics by high-performance thin-layer chromatography (HPTLC) and comparison to mass spectrometry-based shotgun lipidomics
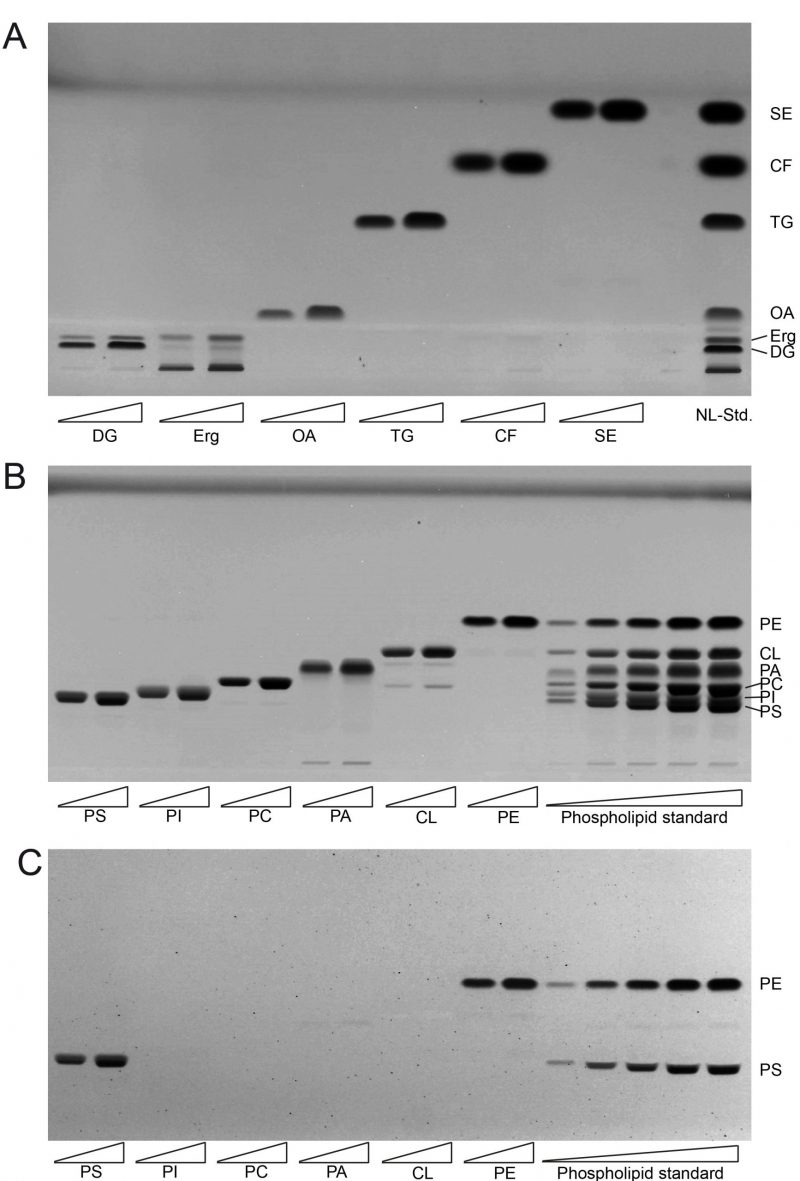
FIGURE 1: Establishing lipid standards for HPTLC. (A) Developed HPTLC plate showing single components of neutral lipid standard (NL-Std.) with an absolute input of 5 µg (left) and 10 µg (right). (B) Developed HPTLC plate showing single components of phospholipid standard (PL-Std.) with an absolute input of 5 µg (left) and 10 µg (right). In the final five lanes the whole PL-Std.-mixture was applied at increasing concentrations from 500 ng to 12.5 µg absolute mass. (C) The developed HPTLC-plate from panel B was derivatised using ninhydrin to visualise PS and PE only. FA, fatty acid; TG, triglyceride; CF, cholesterylformate; SE, sterol ester; Erg, ergosterol; DG, diglyceride, PI, phosphatidylinositol; PC, phosphatidylcholine; PE, phosphatidylethanolamine; PS, phosphatidylserine; CL, cardiolipin; PA, phosphatidic acid.