
Back to article: Quantifying yeast lipidomics by high-performance thin-layer chromatography (HPTLC) and comparison to mass spectrometry-based shotgun lipidomics
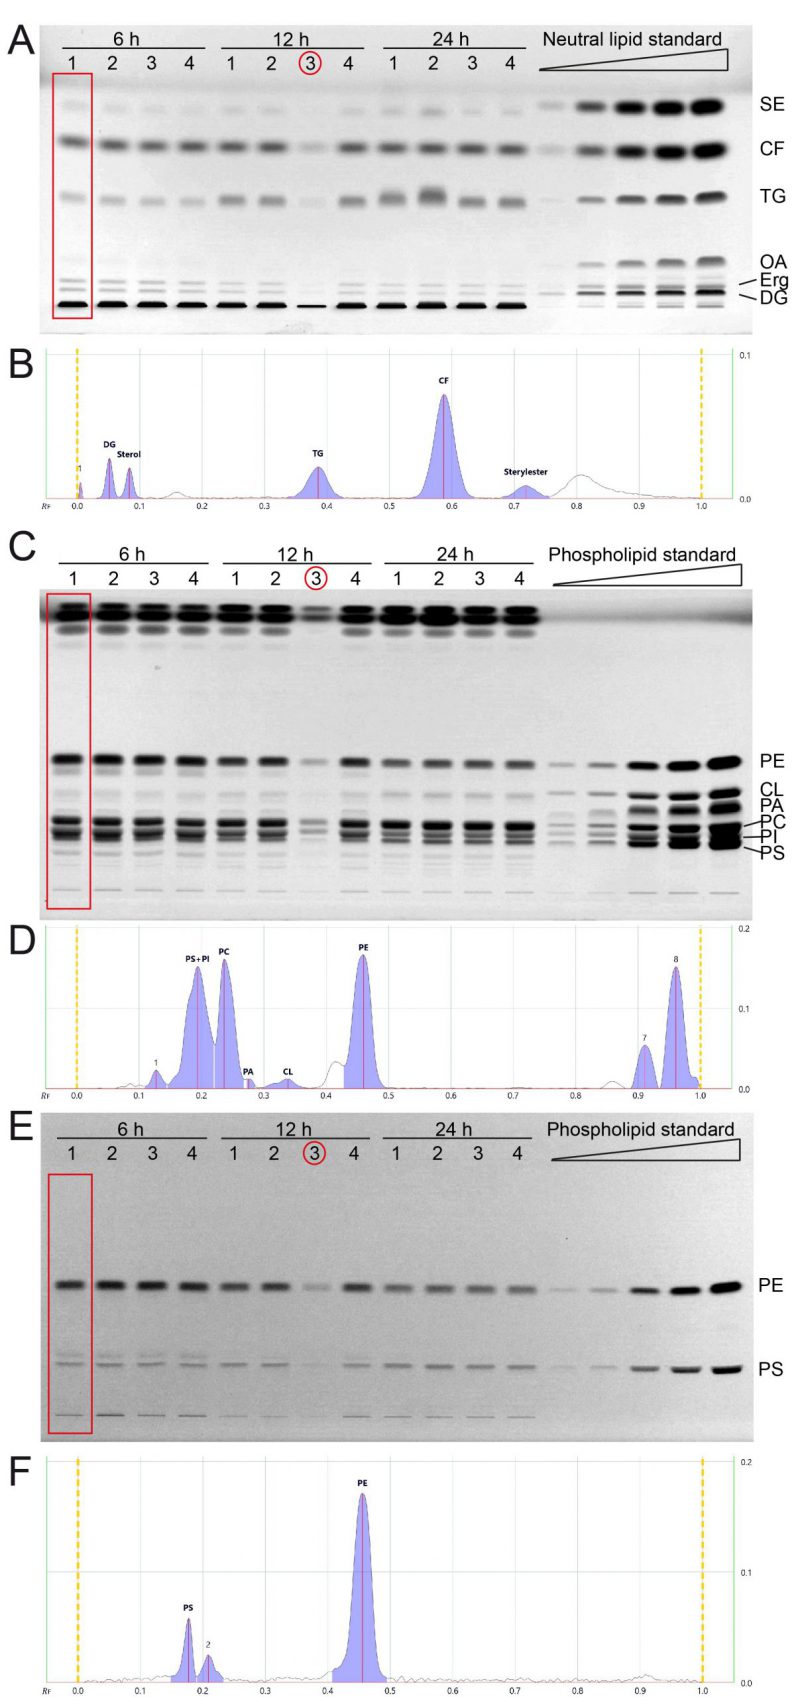
FIGURE 2: All major lipid classes of whole cell yeast extracts can be separated and quantified in two separate runs for neutral and phospholipid analysis using HPTLC. (A) Neutral lipids were separated by HPTLC with a mobile phase consisting of n-hexane, n-heptane, diethylether, and acetic acid (63/18.5/18.5/1 v/v). Lipids were derivatised using primuline. (B) Example chromatogram with peak integration of lane 1, corresponding to the red rectangle in panel A (Wt 1, 6 h) (C, E) HPTLC plate showing phospholipid separation, sequentially derivatised using Primulin (C) to visualize all lipids and then applying ninhydrin (E) to visualise lipids containing free amino-groups such as PE and PS. As an example of chromatogram peak integration, representative chromatograms of lane 1 from (C) and (E) are shown in (D) and (F), respectively. *During the lipid preparation of the third replicate of the 12 h condition (indicated by red circle) material was lost, which resulted in lower overall concentration/yield.