
Back to article: Quantifying yeast lipidomics by high-performance thin-layer chromatography (HPTLC) and comparison to mass spectrometry-based shotgun lipidomics
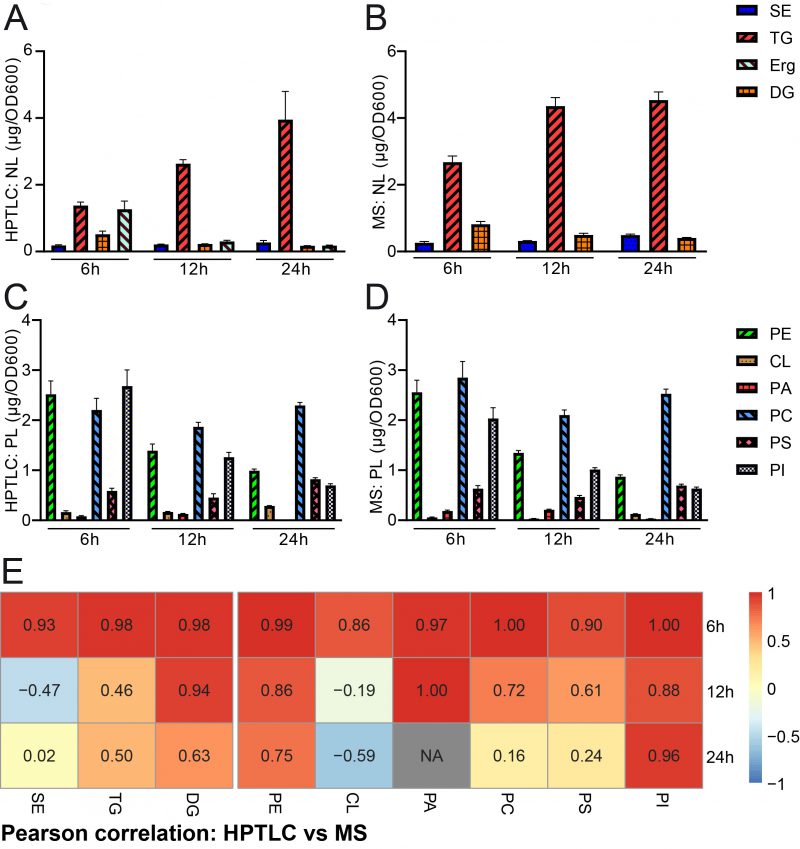
FIGURE 3: Comparative quantification of HPTLC-lipidomics and MS-assisted shotgun lipidomics. (A, B) HPTLC-derived neutral lipidomic quantification (A) and analysis of the same samples by MS-based shotgun lipidomics (B) deliver comparable results regarding absolute amounts of total neutral lipids in yeast. (C, D) HPTLC-derived phospholipidomic quantification (C) and analysis of the same samples by shotgun lipidomics (D) deliver comparable results regarding absolute amounts of the major phospholipid classes in yeast. (E) Pearson correlation analysis comparing HPTLC with MS results. Additional relative data quantification in mol % is depicted in Fig. S1 and scatter plots visualising individual pairs for Pearson correlation are shown in Fig. S2.