
Back to article: Quantifying yeast lipidomics by high-performance thin-layer chromatography (HPTLC) and comparison to mass spectrometry-based shotgun lipidomics
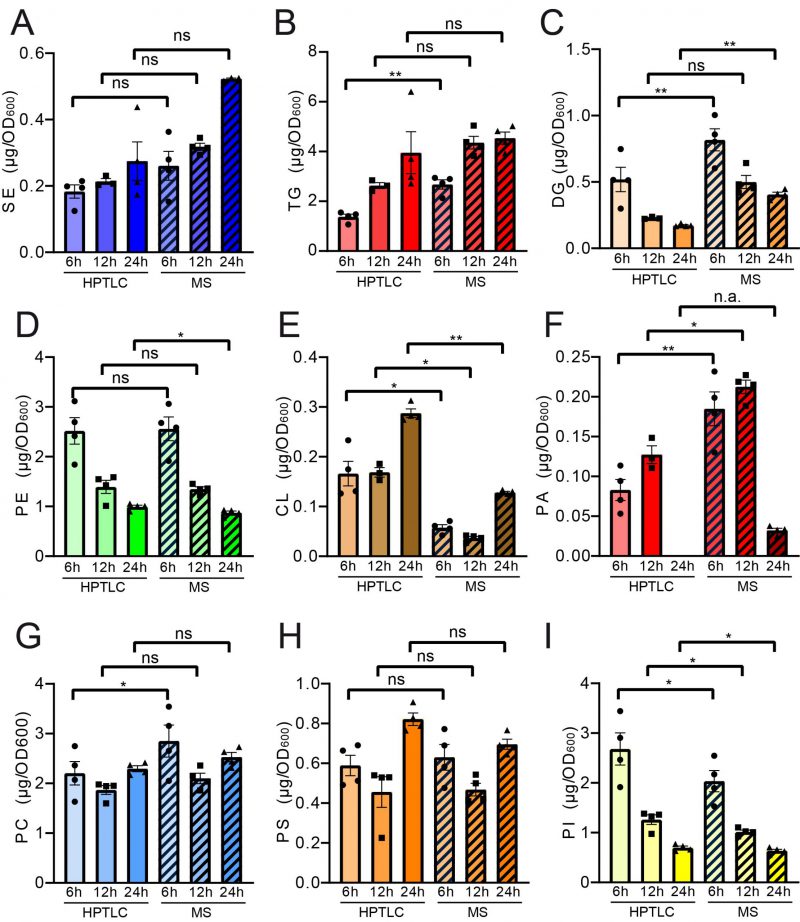
FIGURE 4: Paired statistical analysis of individual lipid classes (absolute) for HPTLC-lipidomics vs. MS-assisted shotgun lipidomics reveals similarities and differences between both methods. Neutral lipids are compared in panels (A-C) and phospholipid comparisons are given in panels (D-I). Statistical analysis was performed using paired tests: TG, DG, SE, CL, PA, PC, PS and PI were analysed using mixed effects analysis with Sidaks's multiple comparisons test; PE was analysed using RM ANOVA with Holm-Sidak's multiple comparisons test. Relative representation in mol % is depicted in Figure S3.