
Back to article: Quantifying yeast lipidomics by high-performance thin-layer chromatography (HPTLC) and comparison to mass spectrometry-based shotgun lipidomics
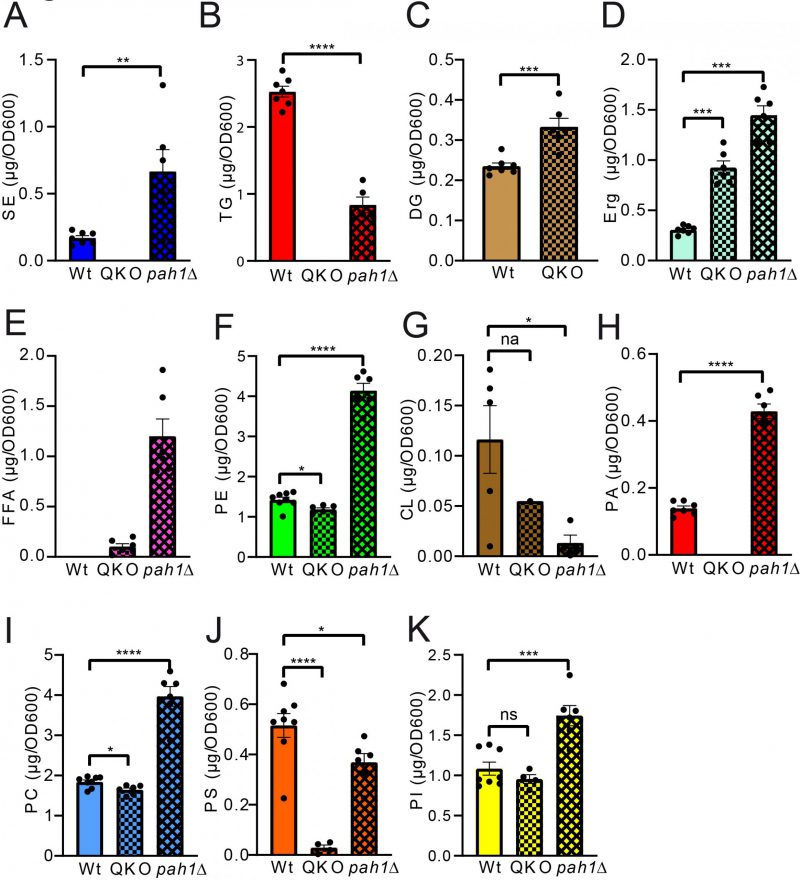
FIGURE 6: Statistical analysis of individual lipid classes comparing QKO and pah1Δ to wildtype. Neutral lipids are compared in panels (A-E) and phospholipid comparisons are given in panels (F-K). SE, TG, DG, CL, and PA were analysed using unpaired T-test; PS and PI using ordinary one-way-ANOVA; TG, SE, PC, PS, and PI using Kruskal-Wallis test and PC, Erg and PE using Brown-Forsythe and Welch ANOVA.