
Back to article: Exploring carbon source related localization and phosphorylation in the Snf1/Mig1 network using population and single cell-based approaches
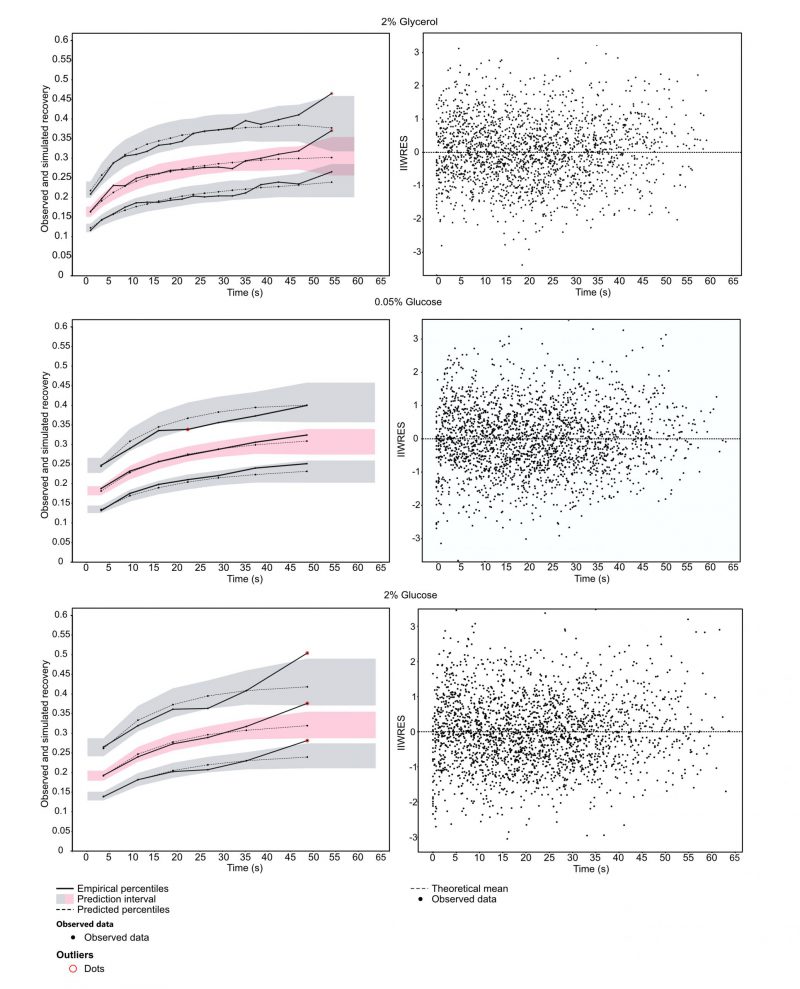
FIGURE 1: Diagnosticplots of the NLME model used to predict population parameters. Left panel: visual predictive check to determine predictive power of the model. Datapoints were binned using least squares criteria and smoothed using linear interpolation. Solid line determines the observed data in the 10th,50th and 90th percentile. Gray/red areas are the prediction intervals for the respective percentile in which 90% of the simulated data lie, determined by 400 Monte Carlo simulations. Right panel: Scatterplots of individual residuals. Dots represent the individual weighted residuals over time represented by conditional mode of the distribution of residuals.