
Back to article: Exploring carbon source related localization and phosphorylation in the Snf1/Mig1 network using population and single cell-based approaches
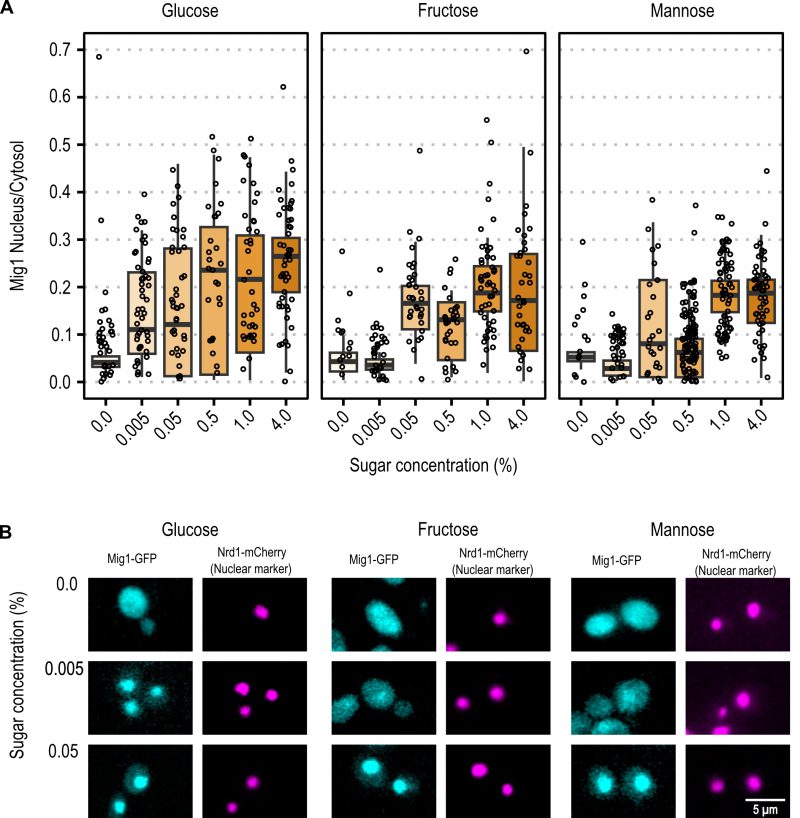
FIGURE 3: Mig1 nuclear localization after upshift. (A) Mig1 nuclear localization ratio in cells 5 minutes after the shift from ethanol to the indicated concentration of glucose, fructose, or mannose. Horizontal lines indicate the mean, the boxplot has as lower and upper hinge respectively the 25thand 75th percentile and the whiskers denote the 95% confidence interval. Dots denote individual cells. (B) Microscopic images of single cells, representative for the tested cells in panel B, 5 minutes after shift from ethanol to the indicated conditions. Mig1-GFP is displayed in cyan and Nrd1-mCherry in magenta. Brightness and contrast have been adjusted for better visibility.