Back to article: Exploring carbon source related localization and phosphorylation in the Snf1/Mig1 network using population and single cell-based approaches


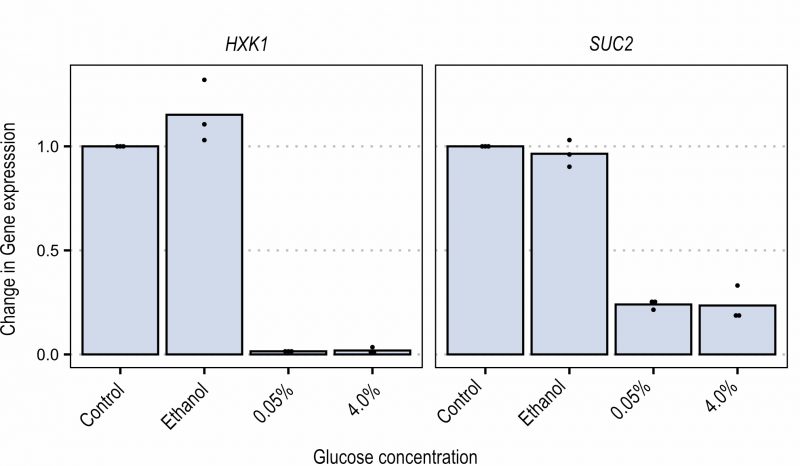
FIGURE 4: Expression of HXK1 and SUC2 measured via qPCR, 15 minutes after shift to glucose.
Data are shown as ratio change of gene expression. Control: baseline expression of cultures grown in ethanol at start of measurements. Dots represent biological replicates.

By continuing to use the site, you agree to the use of cookies. more information

The cookie settings on this website are set to "allow cookies" to give you the best browsing experience possible. If you continue to use this website without changing your cookie settings or you click "Accept" below then you are consenting to this. Please refer to our "privacy statement" and our "terms of use" for further information.

Close