
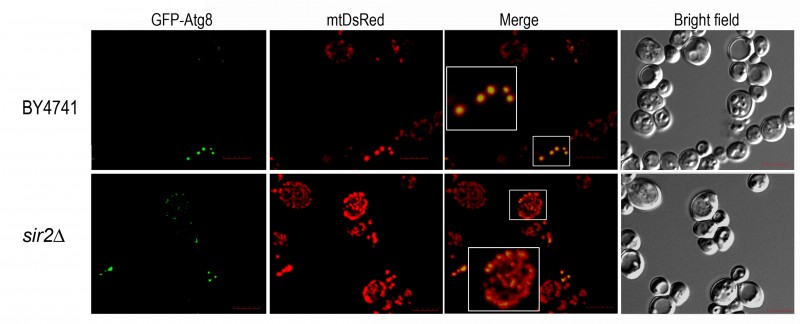
FIGURE 3: SIR2 deleted cells exhibit increased mitochondrial mass and altered mitochondria network.
Wild type and sir2D (background BY4741) cells expressing, GFP-Atg8 and mtDsRed were analyzed for mitophagy by confocal fluorescence microscopy. The cells were collected and analyzed at day 3 of chronological lifespan. Mitophagy was analyzed by the pattern of co-localization between GFP-Atg8 and mtDsRed, as exemplified. Images were acquired in a confocal Olympus FLUOVIEW microscope with an Olympus PLAPON 60X/oil objective, with a numerical aperture of 1.35. GFP and DsRed were excited with and argon laser and a helium-neon laser (GFP: 488 nm excitation; DsRed: 559 nm excitation). Background reduction was performed with appropriate saturation levels using software FV1000 (Olympus) and Adobe Photoshop CS. Image stacks for analysis were acquired with sequential steps of 0.25 to 0.5 µm per plane in the z-direction and a total thickness of 4-6 µm. The acquired stacks were rendered with FV1000 software. Scale bars: 5 µm.