
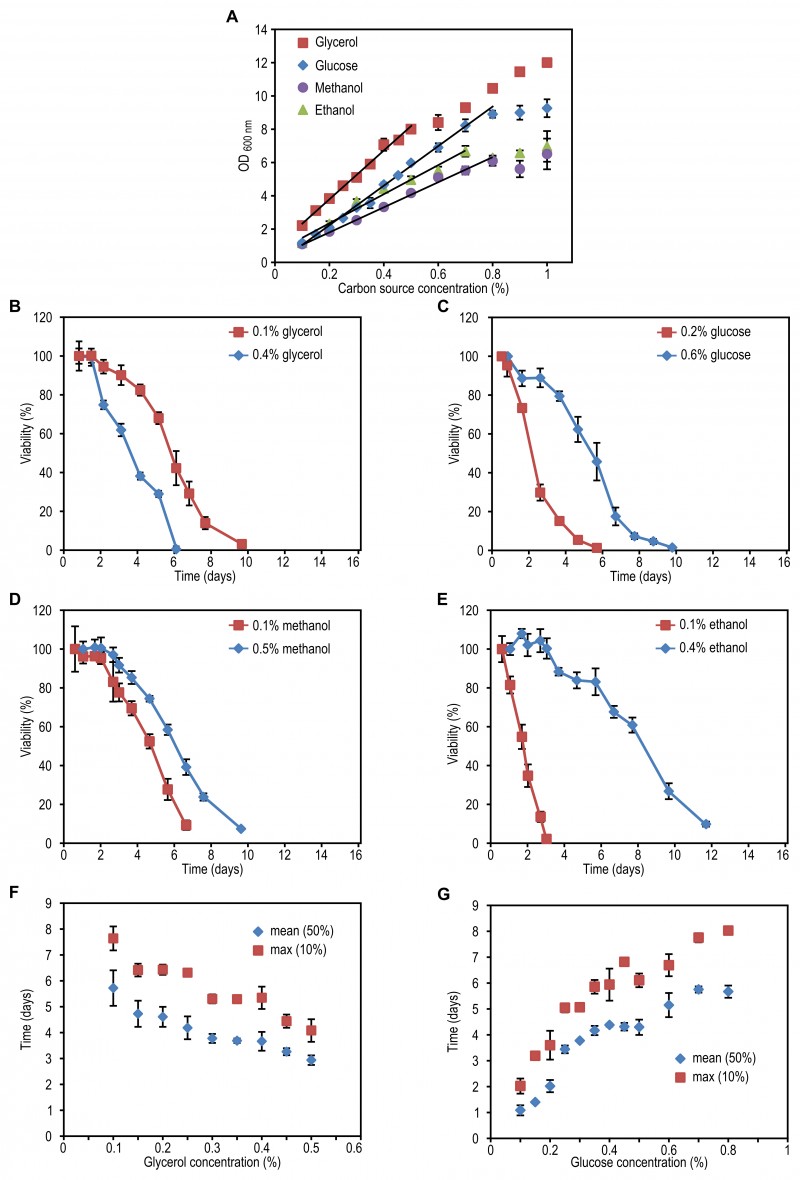
FIGURE 1: The effect of carbon source concentration on yeast chronological lifespan.
H. polymorpha cells were grown on various concentrations of the indicated carbon sources and 0.25% methylamine as nitrogen source. The OD600 nm was measured when cultures did exit the growth phase (A). Lines indicate ranges in which a linear correlation (R>0.98) between final OD and carbon source concentration was observed. Data represent mean ± SD (n=3). Chronological lifespan of cells grown at a low and a high concentration of glycerol (B), glucose (C), methanol (D), ethanol (E). Mean lifespan (mean) and maximum lifespan (max) were calculated as the time when cultures reach 50% and 10% viability, respectively, for cultures grown on different concentrations of glycerol (F) or glucose (G). Data represent mean ± SD from 4 to 12 independent cultures.