
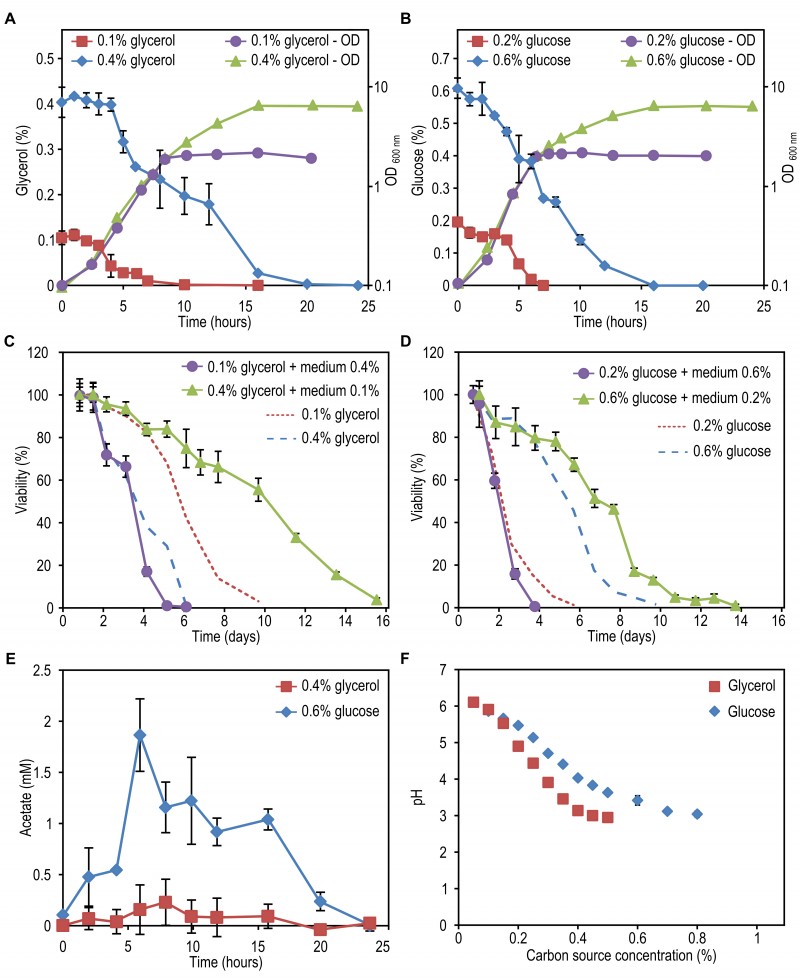
FIGURE 2: The impact of extracellular factors on DR mediated lifespan changes.
Cells were grown on 0.1% and 0.4% glycerol (A) as well as 0.2% and 0.6% glucose (B). Growth and carbon source depletion were monitored in time. Data represent mean glycerol or glucose concentration ± SD (n=3) and mean OD600nm ± SD.
Cells were grown on 0.1% and 0.4% glycerol (C) or 0.2% and 0.6% glucose (D). Spent medium of cultures grown on one concentration of carbon source was replaced by the spent medium originating from cultures grown on the second concentration of the same carbon source and viability of the cultures was measured in time. Data represent mean viability ± SD from 3 independent cultures. Lines indicating viability of cultures left in its own medium were redrawn from Figure 1B and 1C.
(E) The concentration of acetate was measured in clarified medium at different time points upon shifting the cells to medium containing 0.4% glycerol or 0.6% glucose and 0.25% methylamine. Data represent mean ± SD (n=3).
(F) Cells were grown on different concentrations of glycerol or glucose. The pH of the cultures was measured at the beginning of the stationary phase. Data represent mean ± SD (n=3).