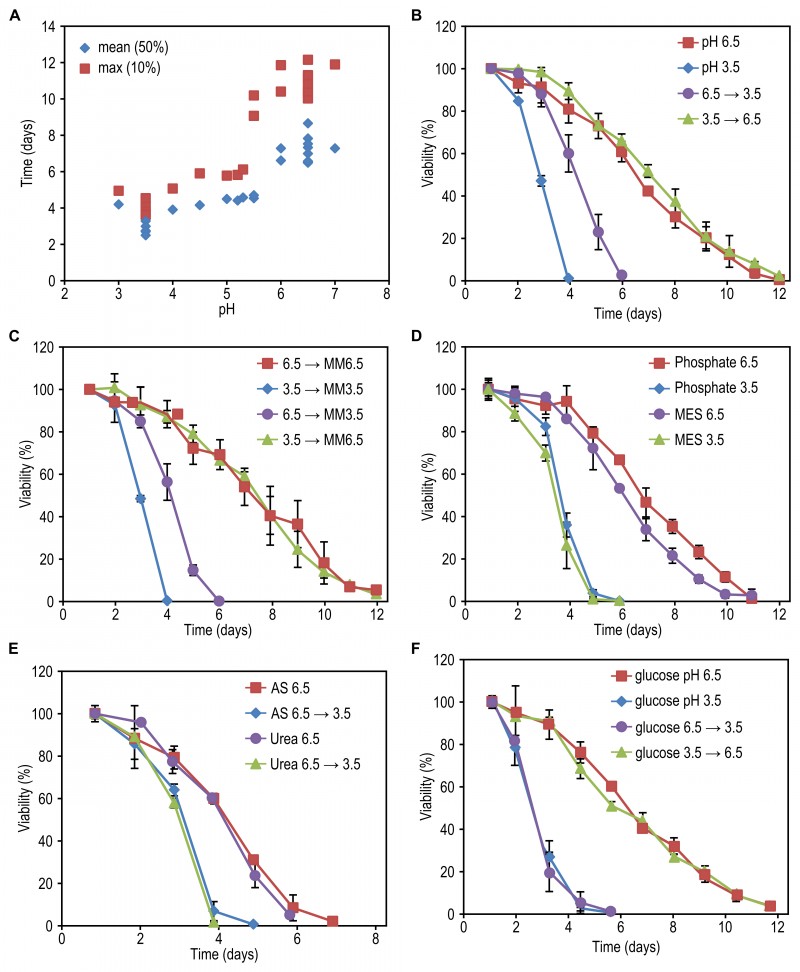
FIGURE 3: The effect of medium pH on yeast chronological lifespan.
(A) Cells were grown on 0.2% glycerol and 0.25% methylamine in batch fermenters at different pH values. After 20h cells were shifted to flasks and the viability of the cultures was measured over time. Data represent time when viability of the cells reached 50% (mean) and 10% (max) for all individual fermenters.
(B) Cells were grown on 0.2% glycerol / 0.25% methylamine at pH 6.5 or 3.5. After 20h of cultivation in batch fermenters, the pH of the cultures was changed by the addition of 1 M H3PO4 (6.5 à 3.5) or 1 M NaOH (3.5 à 6.5). Cells before the pH change were kept as the controls. Data represent mean ± SD (n=3).
(C) Cells were grown on 0.2% glycerol / 0.25% methylamine at pH 6.5 or 3.5. After 20h, spent medium of the cultures was replaced by fresh medium (without carbon source) with a pH of 6.5 (MM6.5) or 3.5 (MM3.5). Data represent mean ± SD (n=3).
(D) Cells were grown on 0.2% glycerol / 0.25% methylamine at pH 6.5 or 3.5. After 20h, spent medium of the cultures was replaced by potassium phosphate buffer pH 6.5 (phosphate 6.5), pH 3.5 (phosphate 3.5) or MES buffer pH 6.5 (MES 6.5) or pH 3.5 (MES 3.5). Data represent mean ± SD (n=3).
(E) Cells were grown on 0.2% glycerol and 0.25% ammonium sulphate (AS) or 0.2% urea at pH 6.5. After 20h of cultivation in batch fermenters, the pH of the cultures was changed by addition of concentrated H3PO4 (6.5 à 3.5). Cells before the pH change were kept as the controls. Data represent mean ± SD (n=2).
(F) Cells were grown on 0.4% glucose / 0.25% methylamine at pH 6.5 (glucose pH 6.5) or 3.5 (glucose pH 3.5) in batch fermenters. After 20h the pH of the cultures was changed by addition of H3PO4 (glucose 6.5 à 3.5) or NaOH (glucose 3.5 à 6.5). Cells before the pH change were kept as the controls. Data represent mean viability ± SD (n=2).

