
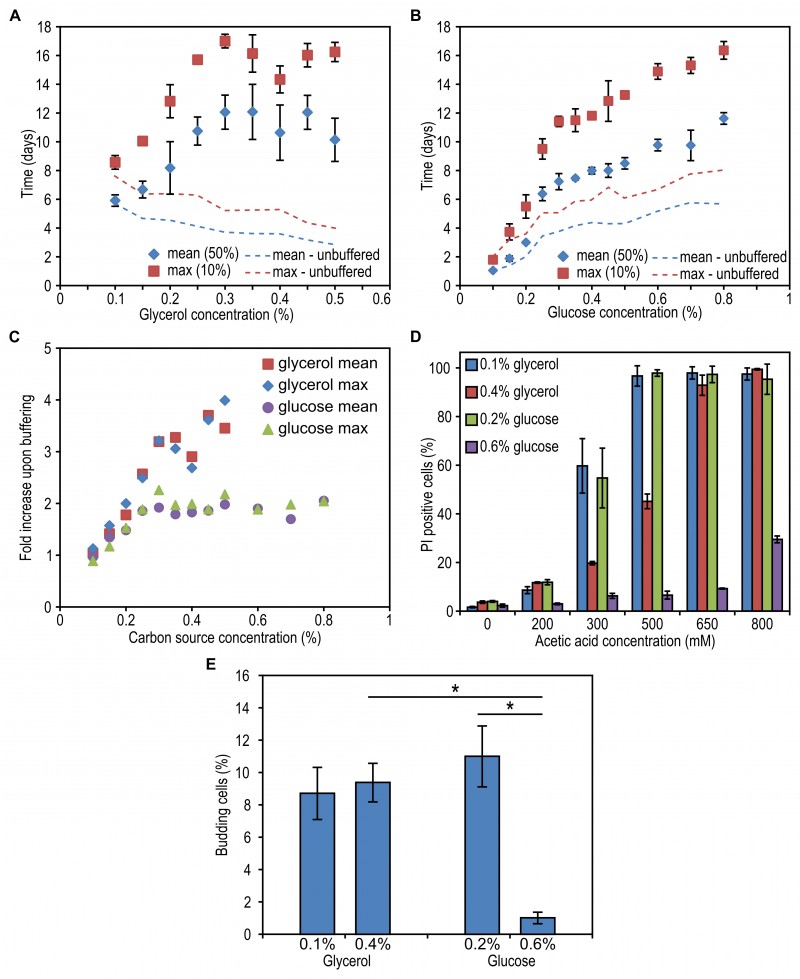
FIGURE 4: The effect of carbon source concentration on yeast lifespan upon buffering of spent medium.
Cells were grown on different concentrations of glycerol (A) or glucose (B) and 0.25% methylamine as the nitrogen source. The pH of the cultures was adjusted to pH 6.5. Data represent mean ± SD from 4 to 8 independent cultures. Trend lines indicating changes in mean and maximum lifespan of cells in non-buffered media were redrawn from Figure 1F and 1G.
(C) Fold increase of mean and maximum lifespan upon buffering the cultures grown on different concentrations of glycerol and glucose calculated as lifespan after buffering divided by lifespan before buffering.
(D) The resistance of cells to acetic acid treatment. Upon exit of the growth phase, cells were treated with increasing concentration of acetic acid followed by PI staining and FACS analysis. Data represent mean number of PI positive cells ± SD from 4 cultures.
(E) The number of budding cells upon exit from the growth phase in unbuffered medium. Data represent mean percentage of cells containing a bud from 6 cultures ± SD.