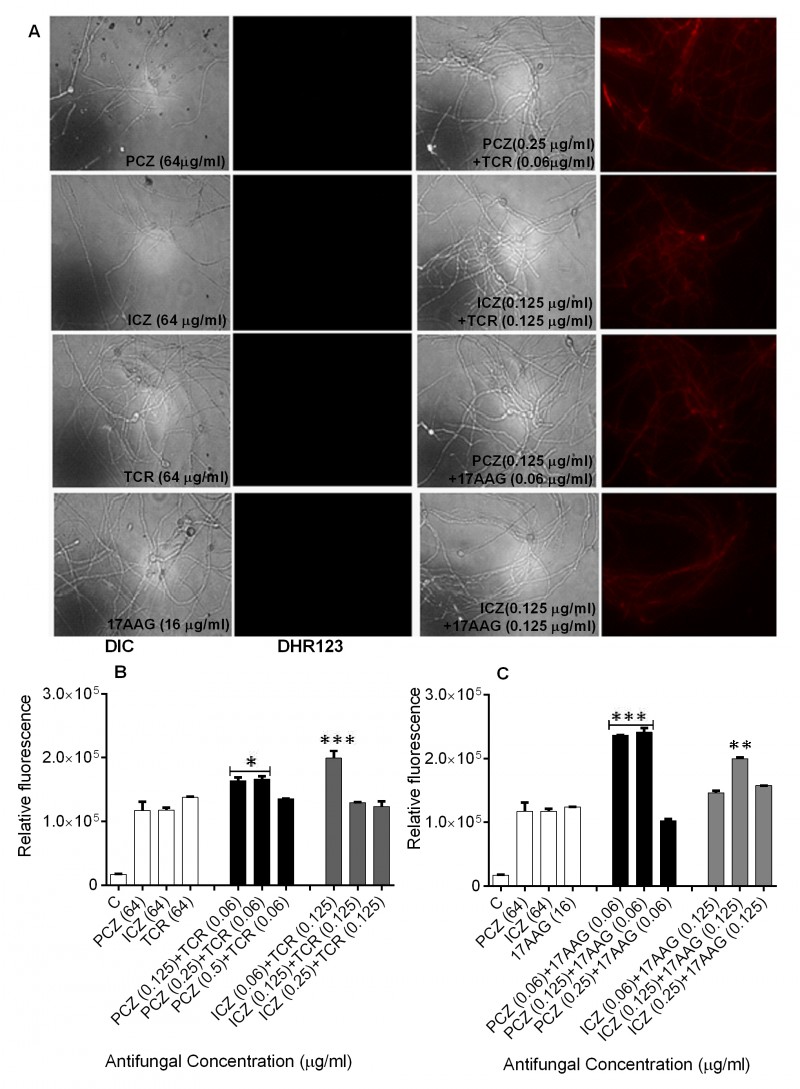
FIGURE 2: Intracellular ROS accumulation as detected by DHR-123 in S. prolificans isolate 1 germlings treated with PCZ or ICZ with either TCR or 17AAG, was measured using fluorescence spectrophotometry.
(A) Fluorescent images of S. prolificans stained with DHR-123.
(B) Relative fluorescence levels in S. prolificans germlings treated with PCZ or ICZ in combination with TCR.
(C) Measurement of fluorescence of germlings treated with PCZ or ICZ in combination with 17AAG. *p<0.05; **p<0.001; ***p<0.0001. Error bars on graphs indicate standard deviation. DIC, differential interference contrast.

