
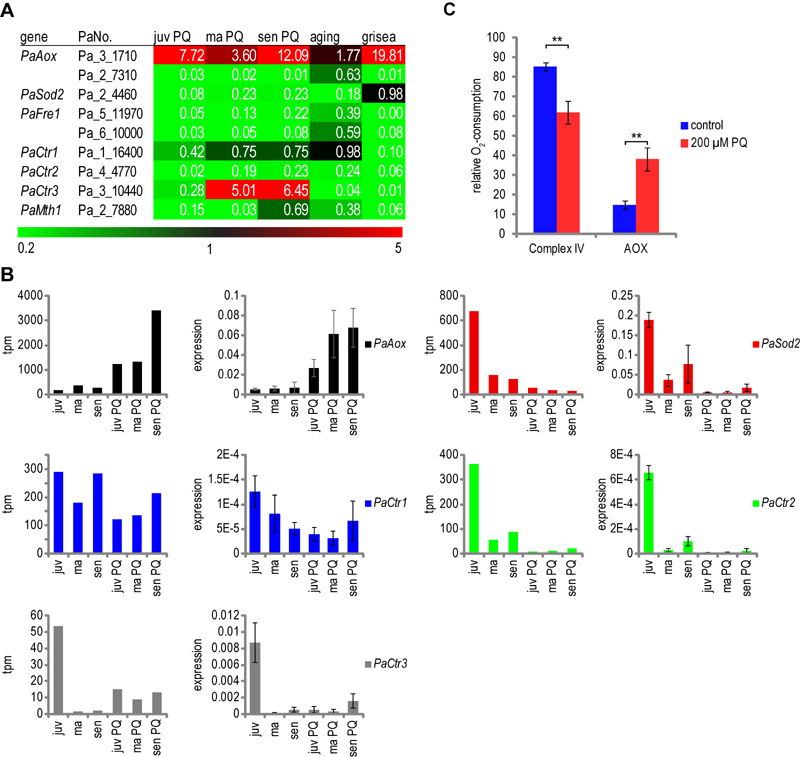
FIGURE 5: Effect of PQ-stress on the regulation of copper controlled genes.
(A) Transcriptome data of copper and GRISEA regulated proteins. Colors and numbers indicate relative expression of transcripts of the indicated genes. Relative expression was calculated by dividing tpm of juvenile PQ-stressed samples by tpm of juvenile control (juv PQ), middle-aged PQ-stressed samples by middle-aged control (ma PQ), senescent PQ-stressed samples by senescent control (sen PQ), senescent control by juvenile control (aging) and grisea by wild-type control (grisea).
(B) Verification of transcriptome data of the selected genes PaAox, PaSod2, PaCtr1, PaCtr2, and PaCtr3. Results from SuperSAGE analysis are shown in tpm (tags per million). The results of the corresponding qRT-PCR are depicted as relative expression levels to the reference genes PaPorin and PaRpl19. Data are displayed as mean ± standard error. n = 3.
(C) Measurement of complex IV and PaAOX activity in control and PQ-stressed mycelia. Juvenile P. anserina was grown as described for transcriptome analysis. The oxygen consumption of 2 to 9 mg mycelium was measured in a high resolution respirometer. To determine the percentage of complex IV and PaAOX dependent respiration, a final concentration of 4 mM SHAM and 1 mM KCN was used to inhibit PaAOX and complex IV, respectively. Bars are mean ± standard error of 6 – 7 experiments with two different cultures. n = 20. Student’s t-test: pV = 0.0019.