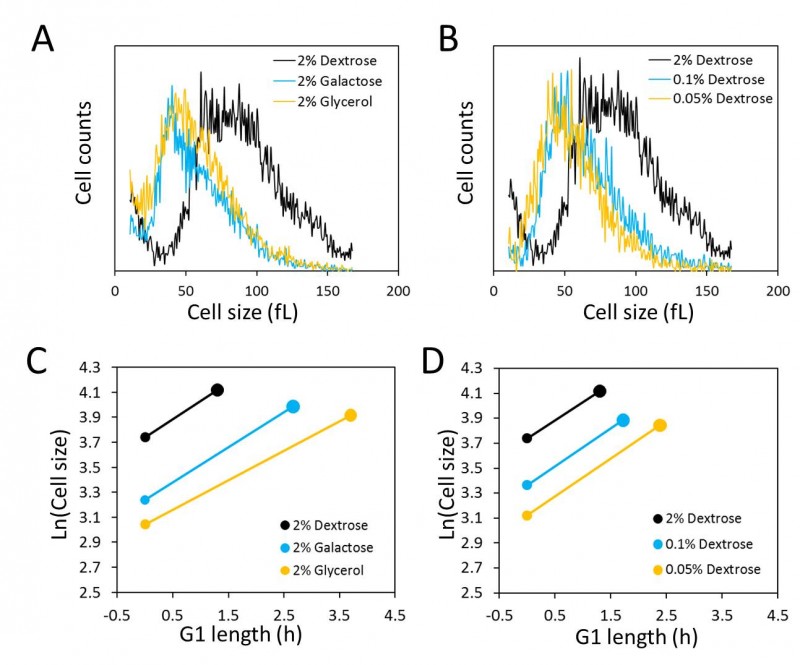
FIGURE 1. Nutrient control of size homeostasis and rate of size increase.
(A) and (B) Cell size histograms of exponentially and asynchronously proliferating wild type diploid cells (strain BY4743), cultured in 1% w/v yeast extract, 2% w/v peptone and the indicated amount of the carbon source shown. The x-axis is cell size and on the y-axis is the number of cells.
(C) and (D) Graphical representation of G1 variables in the growth conditions shown in A and B, using the values shown in Table 1. The x-axis is the calculated length of the G1 phase and the y-axis is the natural log of cell size at birth. The birth size at each condition is indicated with the smaller filled circle and the critical size with the larger filled circle. The length of the line connecting birth size with critical size is equal to the length of the G1 phase (TG1 in Table 1), and the slope of the line is equal to the specific rate of size increase (k in Table 1).

