
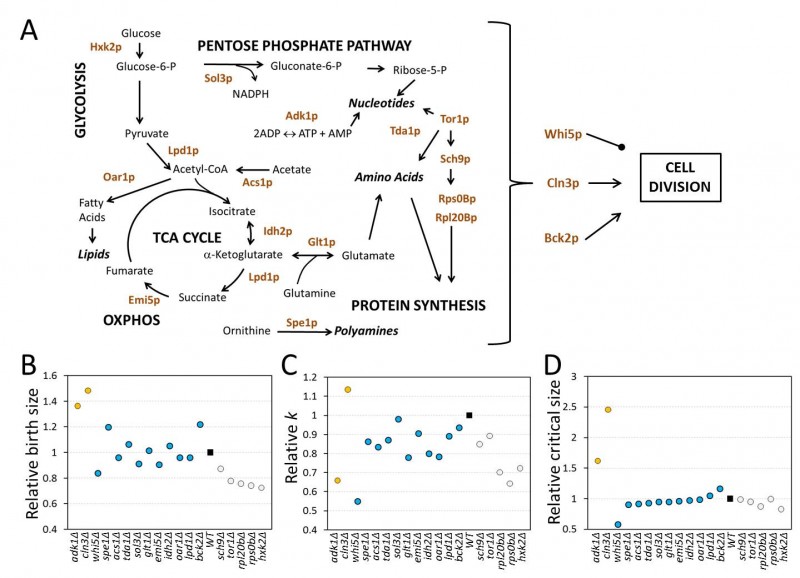
FIGURE 3:Diverse G1 phenotypes of metabolic and biosynthetic mutants.
(A) Schematic overview of the reactions affected by the gene products we examined. This is a simplified view for clarity, missing numerous intervening reactions.
(B) The birth size of each mutant shown on the x-axis was calculated for each deletion strain in the BY4741 and Y7092 background, shown in Table 2. For each gene deletion, the values from the two strain backgrounds were averaged, expressed relative to the corresponding value of the wild type, and shown on the y-axis. The gene deletions were group in three groups, based on principal component analysis and k-means clustering, using the R open source software, from the data shown in Table 2. The filled square is the wild type value.
The relative specific rate of size increase (C) and critical size (D) are shown for each gene deletion, calculated and displayed as in (B), from the data shown in Table 2.