
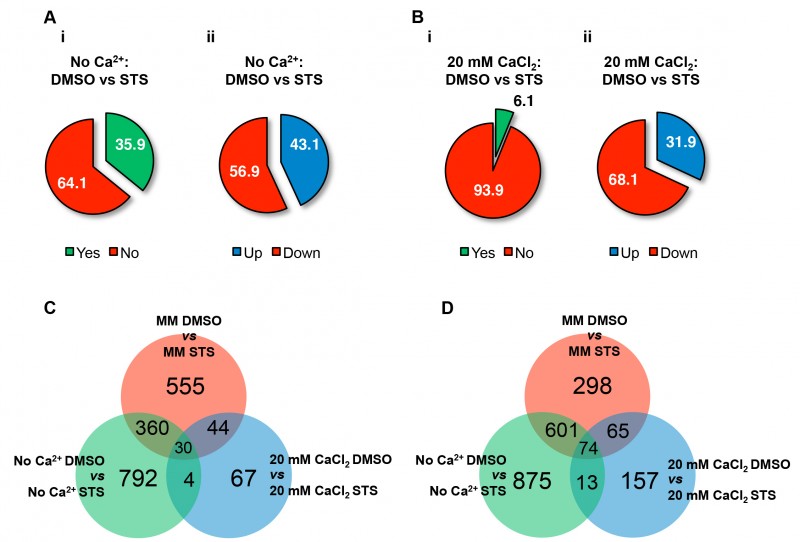
FIGURE 3: Overview of the N. crassa transcriptional response to staurosporine in minimal media containing different concentrations of Ca2+.
(A-B) The percentages of genes with altered expression upon treatment with staurosporine (i) and the fraction of induced and repressed genes (ii) were calculated for culture medium with no Ca2+ (A) or with 20 mM CaCl2 (B).
(C-D) Venn diagrams were used to assess the amount of Ca2+-specific staurosporine-induced (C) and -repressed genes (D). General statistics for Ca2+-specific transcriptional responses are included.