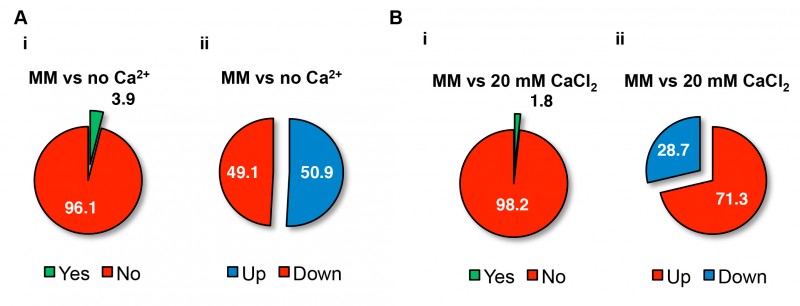
FIGURE 4: Overview of the N. crassa transcriptional response to limited or excess Ca2+.

(A-B) The percentages of genes with altered expression (i) and the fraction of induced and repressed genes (ii) were calculated for no Ca2+ (A) and 20 mM CaCl2 medium (B) in comparison with standard MM.

By continuing to use the site, you agree to the use of cookies. more information

The cookie settings on this website are set to "allow cookies" to give you the best browsing experience possible. If you continue to use this website without changing your cookie settings or you click "Accept" below then you are consenting to this. Please refer to our "privacy statement" and our "terms of use" for further information.

Close