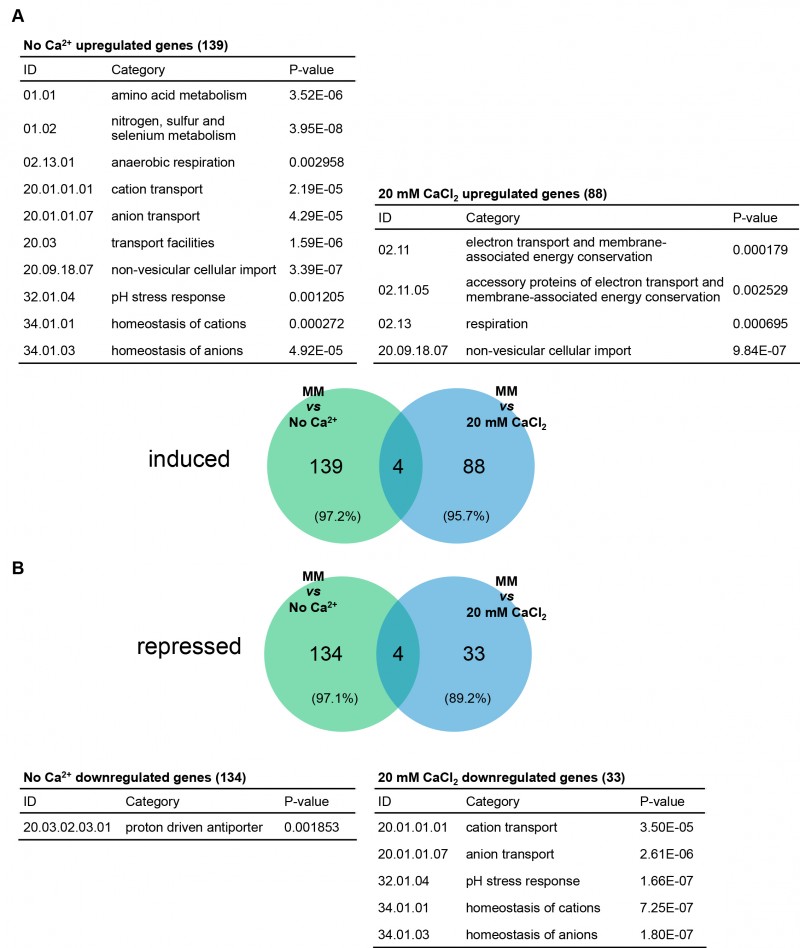
FIGURE 5: Functional enrichment analysis of the transcriptional alterations caused by limited or excess Ca2+.

(A-B) The transcriptional response to the absence or excess of Ca2+ was investigated by building Venn diagrams showing the distribution of genes with induced (A) or repressed (B) expression in no Ca2+ and 20 mM CaCl2 medium. Lists of enriched categories are included.

By continuing to use the site, you agree to the use of cookies. more information

The cookie settings on this website are set to "allow cookies" to give you the best browsing experience possible. If you continue to use this website without changing your cookie settings or you click "Accept" below then you are consenting to this. Please refer to our "privacy statement" and our "terms of use" for further information.

Close