
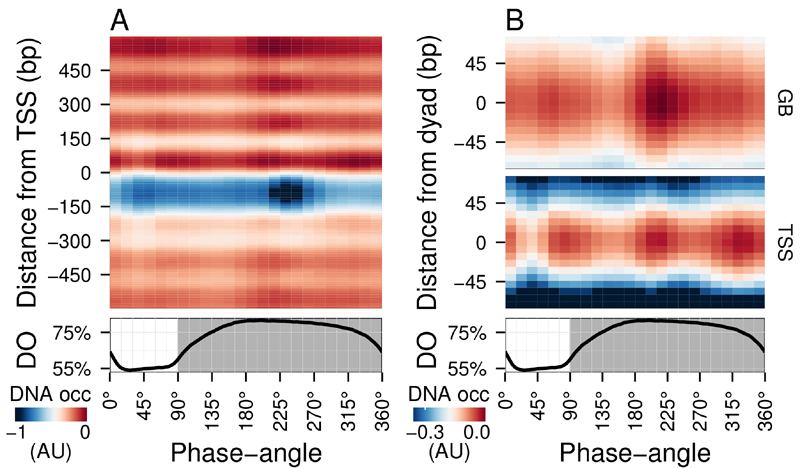
FIGURE 1: Average DNA occupancy dynamics around TSS during one respiratory cycle.
An average cycle was constructed by a cubic spline fitting of the dataset (normalized by the least variant set [27]) comprising three respiratory cycles (33 samples; 6 min sampling; oscillation period 67 min), where protein-bound and genomic DNA sample pairs were extracted using our one-pot method. The median DNA occupancy (DNA occ = log2(pDNA) – log2(gDNA) – MNase bias; see Methods; capped at -1 in A for increased resolution) was calculated for 5140 genes aligned to the transcriptional start site (A; TSS; 0 bp) and aligned to putative nucleosome dyads (B; 0 bp) defined by [4]. Putative nucleosomes were further classified according to their position with respect to TSS as gene body nucleosomes (GB; except for +1/terminal nucleosomes) and TSS nucleosomes. Time is represented as phase-angles calculated according to the respiratory oscillation (represented as a subscript throughout the text), where the minimum first derivative of the residual dissolved oxygen data (bottom panels) represents 0°/360°. Dark grey marks the reductive phase. Median nucleosome profiles at upstream and terminal nucleosomes are shown in Figure S2.
4. Brogaard K, Xi L, Wang J-P, and Widom J (2012). A map of nucleosome positions in yeast at base-pair resolution. Nature 486(7404): 496–501. http://dx.doi.org/10.1038/nature11142
27. Calza S, Valentini D, and Pawitan Y (2008). Normalization of oligonucleotide arrays based on the least-variant set of genes. BMC Bioinformatics 9: 140. http://dx.doi.org/10.1186/1471-2105-9-140