
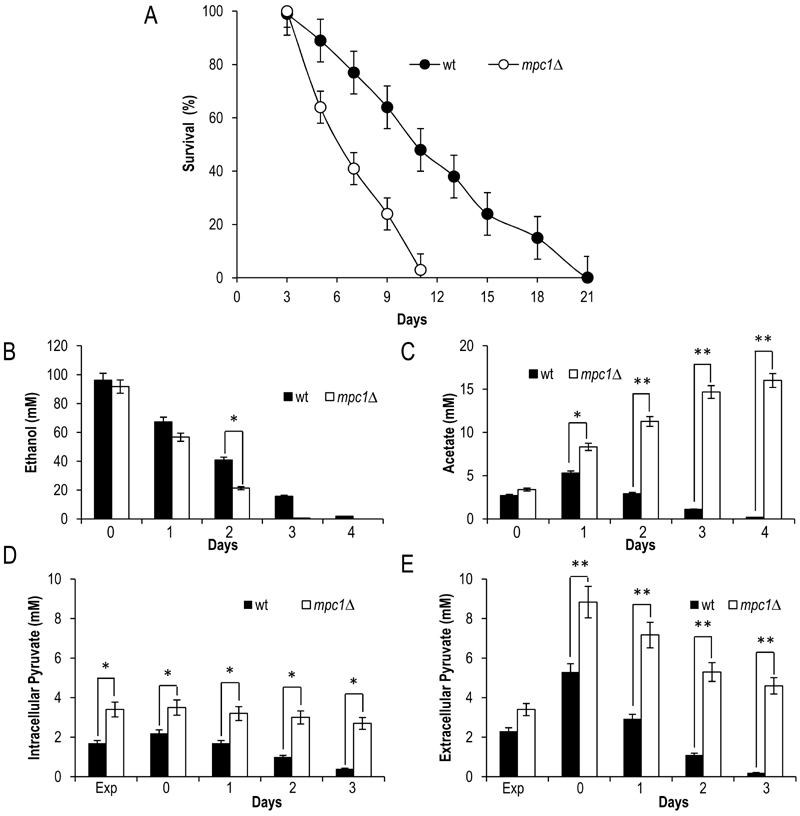
FIGURE 2: MPC1 inactivation shortens CLS in concert with increased extracellular acetate and pyruvate. Wild type (wt) and mpc1Δ mutant cells were grown in minimal medium/2% glucose and the required supplements in excess (see Materials and Methods) and followed up to stationary phase.
(A) CLS of wt and mpc1Δ mutant cells. At each time-point, survival was determined by colony-forming capacity. 72 h after the diauxic shift (Day 3) was considered the first age-point (see Materials and Methods). Day 0, diauxic shift. Data refer to mean values of three independent experiments. Standard deviations (SD) are indicated.
Bar charts of extracellular ethanol (B) and acetate (C) concentrations at different time points after the diauxic shift (Day 0).
In parallel, intracellular (D) and extracellular (E) pyruvate concentrations were measured.
Exp, exponential growth phase. Data refer to mean values of three independent experiments. SD is indicated. Statistical significance as assessedby one-way ANOVA test is indicated (* P ≤ 0.05 and ** P ≤ 0.01).