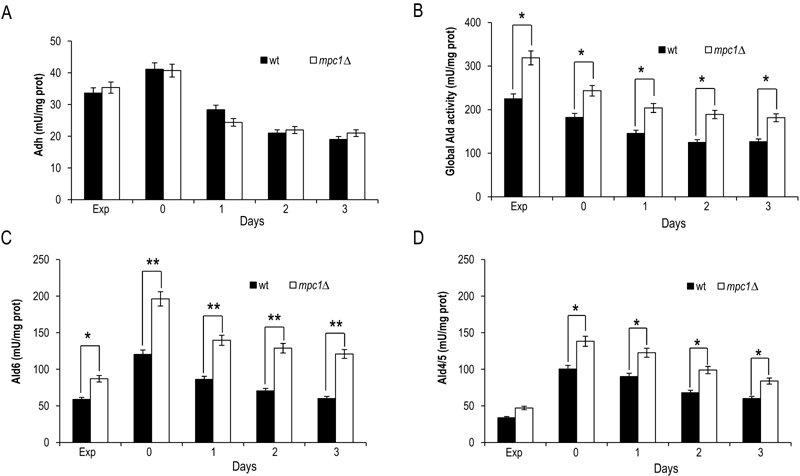
FIGURE 3: In mpc1∆ cells the extracellular abundance of acetate correlates with enhanced Ald enzymatic activity.
Bar charts of total Adh (A), total Ald (B), Ald6 (C) and Ald4/5 (D) enzymatic activities measured at the indicated time points for wt and mpc1Δ mutant cells grown as in Figure 2.
Exp, exponential growth phase. Day 0, diauxic shift. Data refer to mean values determined in three independent experiments. SD is indicated. *P ≤ 0.05 and ** P ≤ 0.01.

