
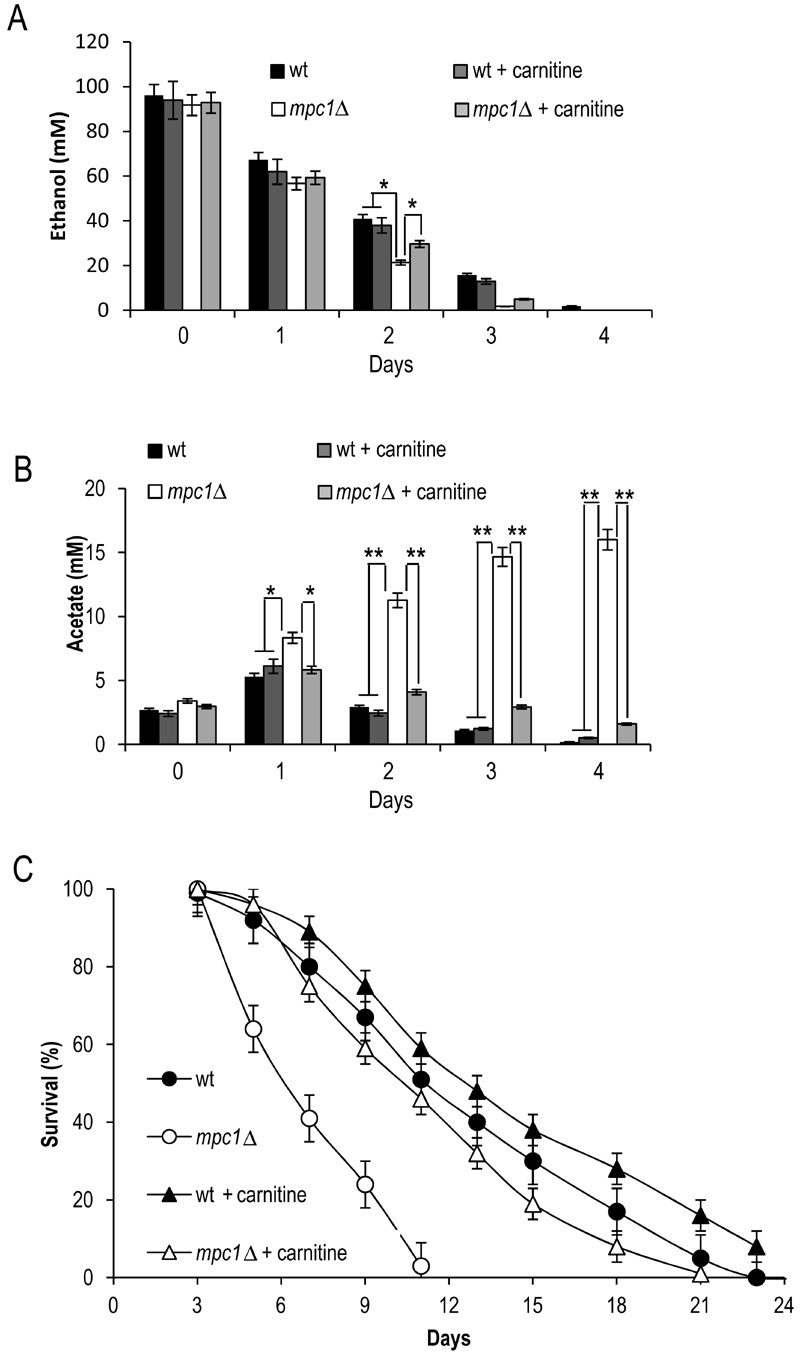
FIGURE 8: Carnitine promotes acetate utilization in the mpc1∆ mutant in concert with increased CLS.
Bar charts of extracellular ethanol (A) and acetate (B) concentrationsat different time points after the diauxic shift (Day 0) measured for cells grown as in Figure 7. (C) CLS of the same cells determined as in Figure 2.
Data refer to mean values of three independent experiments. SD is indicated. * P ≤ 0.05 and ** P ≤ 0.01.