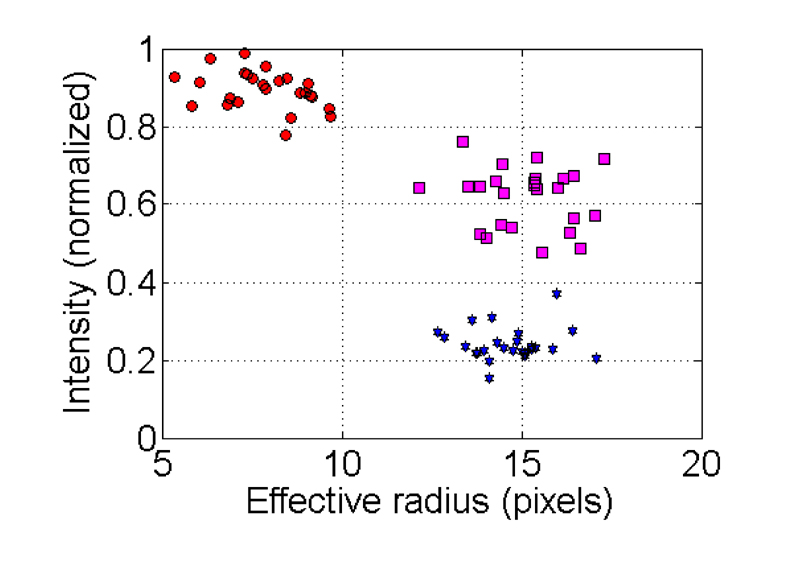
FIGURE 5: Illustration of nuclei distribution according to intensity and effective radius.
Nuclei will affiliate to apoptotic, non-apoptotic, or intermediate states according to the values of their effective radius and intensity parameters.
Red circles correspond to apoptotic nuclei (high intensity and low effective radius area); blue stars correspond to non-apoptotic nuclei data (low intensity and high effective radius area); magenta squares correspond to intermediate states (higher intensity and similar effective radius area compared with non-apoptotic nuclei).

