
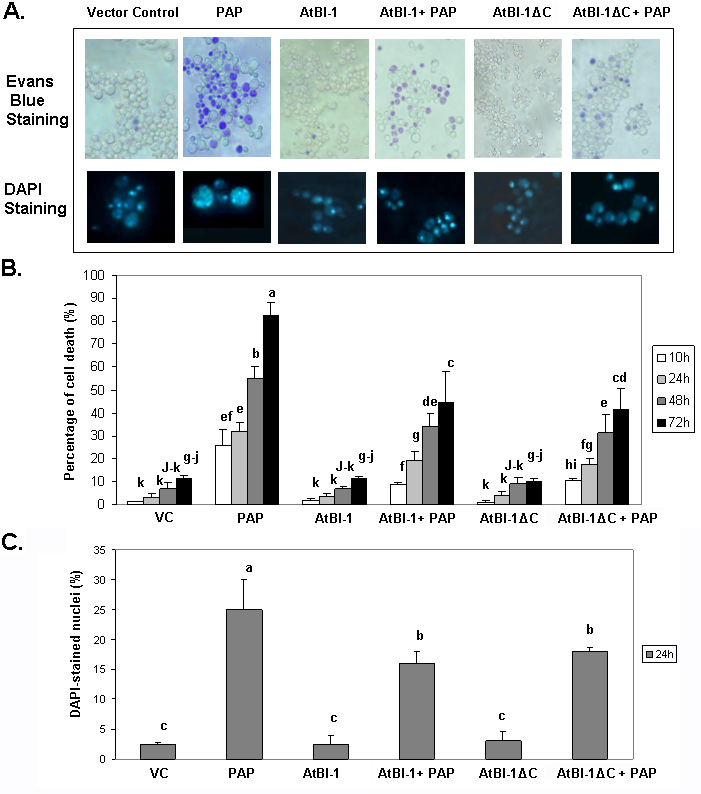
FIGURE 1: Analysis of cell death and nuclear fragmentation in yeast cells expressing PAP, AtBI-1 and AtBI-1ΔC.
(A) Cells were stained with Evans Blue or DAPI at 24 h after induction and visualised using Zeiss Axiovert 200 inverted microscope (magnification, X 40) nuclei are shown enlarged 40 times relative to the yeast cells.
(B) The percentage of the cell death at different hours after induction were quantified and are represented as the means ± standard deviation (n=3).
(C) DAPI stained nuclei at 24 h post-induction were quantified and are represented as the means ± standard deviation (n=3). At least 100 cells were counted per experiment. The results represent three independent experiments. VC – vector control. Columns are statistically different according to ANOVA (P < 0.001) followed by a post-hoc Fisher’s Least Significant Difference (LSD) test.