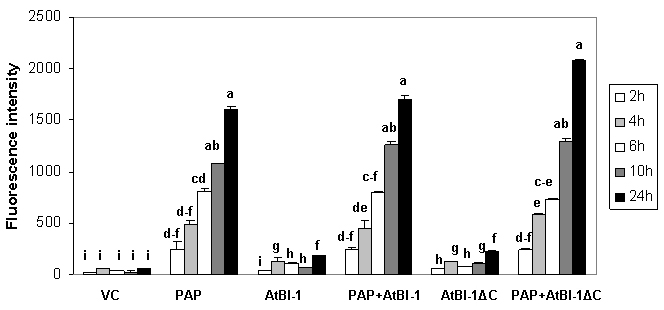
FIGURE 2: ROS generation in cells expressing PAP and AtBI-1.

The amount of H2O2 production was quantified using DCDHF-DA. The results are represented as the means ± standard deviation (n=3). VC – vector control. The results represent three independent experiments. Columns are statistically different according to ANOVA (P < 0.001) followed by a post-hoc Fisher’s Least Significant Difference (LSD) test.

By continuing to use the site, you agree to the use of cookies. more information

The cookie settings on this website are set to "allow cookies" to give you the best browsing experience possible. If you continue to use this website without changing your cookie settings or you click "Accept" below then you are consenting to this. Please refer to our "privacy statement" and our "terms of use" for further information.

Close