
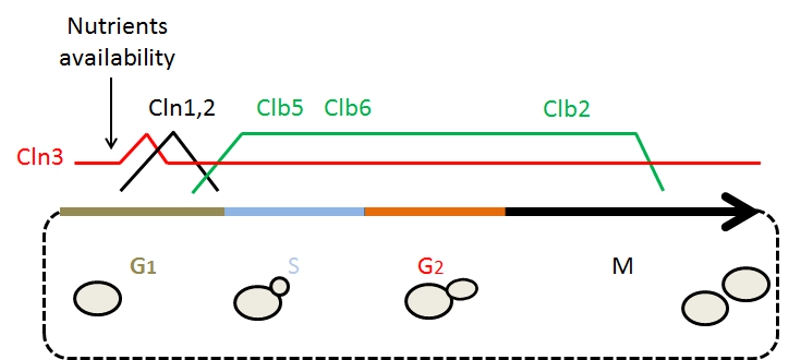
FIGURE 1: The S.cerevisiae cell cycle.
Schematic representation of the yeast cell cycle phases showing the shape of the cells in each phase. Temporal relationship of the different elements represented in the figure with the cell cycle phases, including relative CDK (cyclin-dependent kinases) activity and the presence of the different cyclins throughout the cell cycle. *The presence of the Cln3 protein is fairly constant throughout the cell cycle but it is only biologically available at the moment indicated.