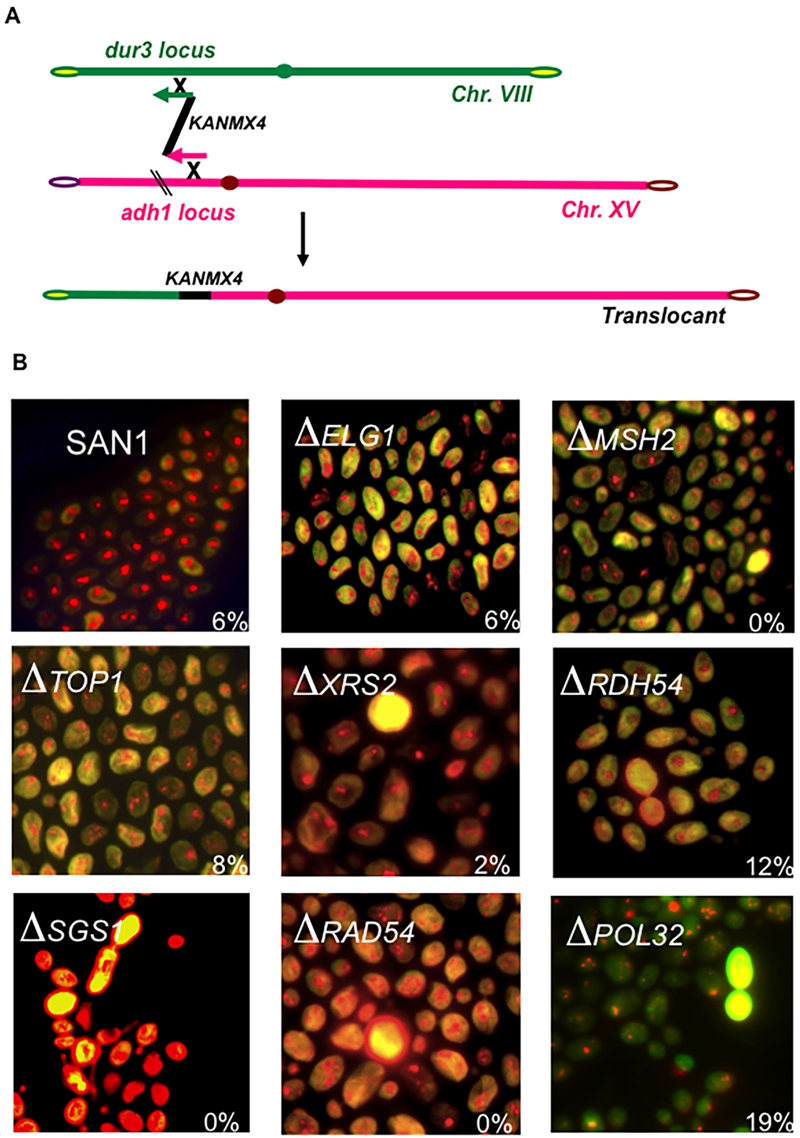
FIGURE 2:
(A) Schematic representation of the BIT translocation between the adh1 locus (Chromosome XV) and the dur3 locus (Chromosome VIII); arrows at the end of the homology indicate the directionality of the translocation.
(B) Fluorescent microphotography of the wild type yeast diploid SAN1 and several deletants of genes involved in the BIT regulatory pathway. The cells were stained with the Live/Dead Viability kit (Molecular Probes) using 6 μM as final dye concentration and fluorescein and rhodamin filters. Dead cells appear as yellow. The percentage of the translocants out of the total number of transformants obtained with the translocation represented in (A) is reported for each strain.

