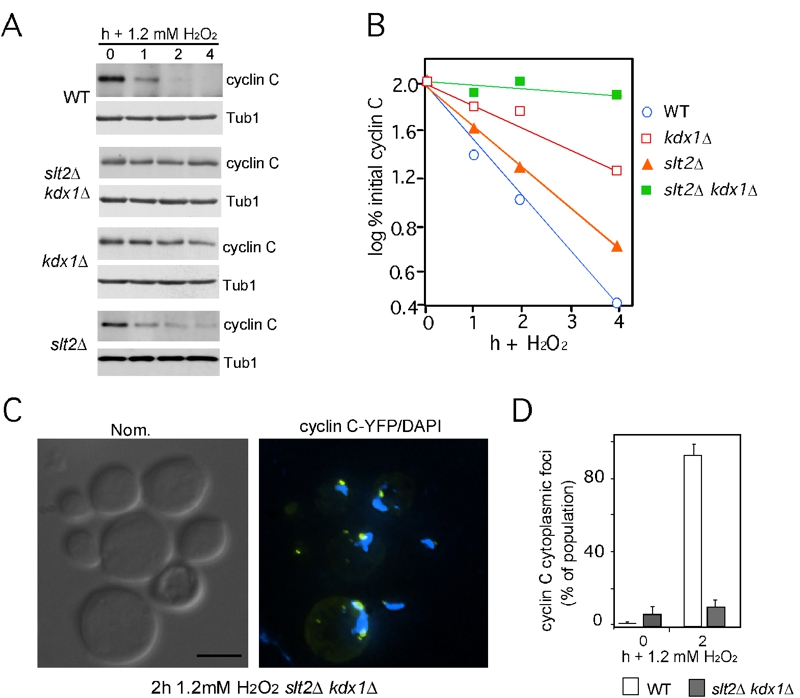
FIGURE 3: Kdx1 and Slt2 promote cyclin C relocalization and destruction in response to 1.2 mM H2O2 stress.
(A) Cyclin C levels were monitored as described previously in wild type (RSY10), slt2∆ kdx1∆ (RSY1737), slt2∆ (RSY1006) and kdx1∆ (RSY1736) strains exposed to 1.2 mM H2O2 for the times indicated. Tub1 levels were used as a loading control.
(B) Quantification of the results obtained in (A).
(C) Cyclin C remains perinuclear in the slt2∆ kdx1∆ strain following 1.2 mM H2O2 stress. Fluorescence microscopy was conducted on mid-log phase on slt2∆ kdx1∆ cells expressing YFP-cyclin C (pBK37) following (2 h) 1.2 mM H2O2 treatment. The cells were fixed, stained with DAPI and then examined by fluorescence microscopy. Representative images (collapsed deconvolved 0.2 µm slices) of the results obtained are shown.
(D) Quantification of the results in C. The percent of the population displaying at least 3 cyclin C-YFP foci in the cytoplasm is given (mean ± s.e.m.). At least 200 cells were counted per time point from 3 individual isolates.

