
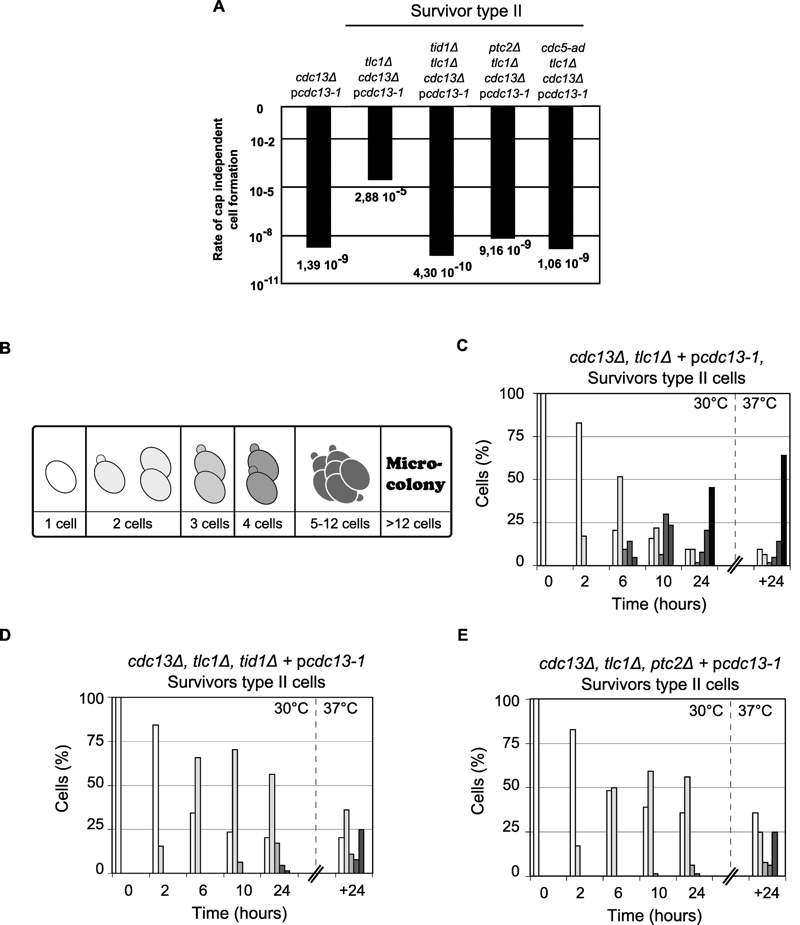
FIGURE 4: The formation of cdc13-independent survivors (cdc13Δ) requires DSB adaptation genes.
(A) The rate of successful colony formation was calculated by fluctuation test foAr five strains: (i) telomerase positive controls, cdc13Δ + pcdc13-1 (VKY20), (ii) type II survivors: tlc1Δ, cdc13Δ + pcdc13-1 (MLY112), (iii) type II survivors harbouring a deletion of TID1: tid1Δ, tlc1Δ, cdc13Δ + pcdc13-1 (VKY19), (iv) type II survivors harbouring a deletion of PTC2: ptc2Δ, tlc1Δ, cdc13Δ + pcdc13-1 (VKY12), or (v) type II survivors harbouring the cdc5-ad allele: cdc5-ad, tlc1Δ, cdc13Δ + pcdc13-1 (MSY421).
(B) Schematic representation of standardization for morphological classification used to analyse cell cycle progression of the strains of interest. (C) (D) (E) Single round unbudded cells (64 cells) from three strains described above (ii) (iii) (iv) were identified and arrayed on YEPD plates and incubated at 30°C (restrictive temperature for the cdc13-1 allele). Morphology and growth of cells were inspected microscopically at 2, 6, 10 and 24 h after incubation. Plates were then incubated at 37°C for another 24 h. Colony morphology was recorded as outlined in (B) and results plotted as the percentage of the initial group.
(C) Cell cycle progression for the survivor type II tlc1Δ, cdc13Δ + pcdc13-1 (MLY112); (D) and (E) cell cycle progression for both adaptation deficient mutants tid1Δ, tlc1Δ, cdc13Δ + pcdc13-1 (VKY19), ptc2Δ, tlc1Δ, cdc13Δ + pcdc13-1 (VKY12).