
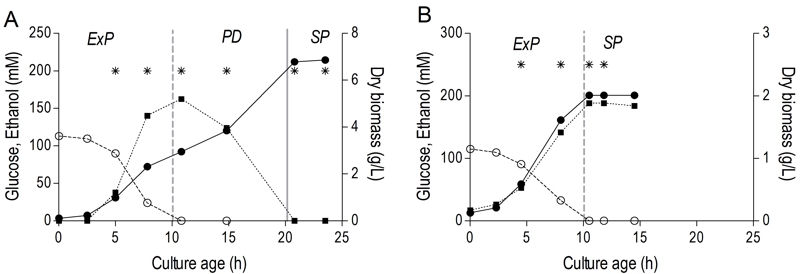
FIGURE 4: Growth phases in aerobic and anaerobic batch cultures.
Biomass (closed circles, ●), glucose (open circles, ○) and ethanol (closed squares, ∎) concentration during the different growth phases of aerobic (A) and anaerobic (B) batch cultures of S. cerevisiae. The initial phase of exponential growth on glucose (ExP), the following post-diauxic phase of slower growth on non-fermentable carbon sources (PD) and final stationary phase (SP) are indicated. Values shown are from single representative batch cultures, independent replicate cultures yielded essentially the same results. Vertical lines indicate depletion of glucose (dashed line) and of fermentation products (solid line). Asterisks (*) indicate time points at which samples were taken for transcriptome analysis.