
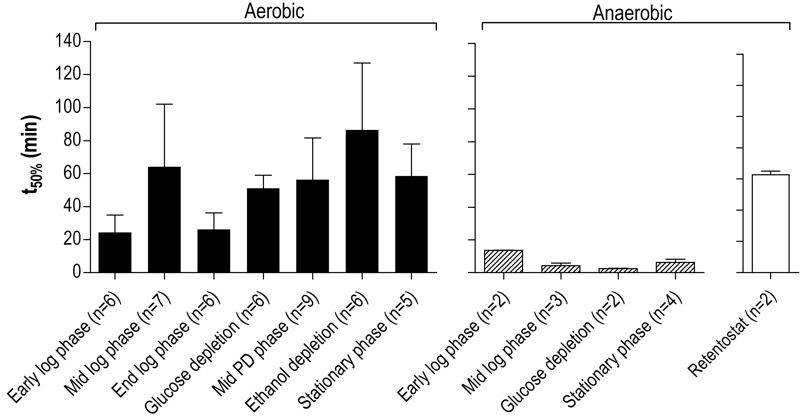
FIGURE 5: Thermotolerance of aerobic and anaerobic cultures during different growth phases.
Thermotolerance of cells during different growth phases of aerobic (black bars) and anaerobic (hatched bars) batch cultures of S. cerevisiae (Figure 4). The white bar depicts the thermotolerance of S. cerevisiae grown for 8 days in anaerobic retentostats [20]. Thermotolerance was assayed by monitoring viability during incubation at 53°C and is shown as the incubation time resulting in a 50% decrease in viability (t50) (see Materials and Methods for more details). The number of independent culture replicates for each of the growth phases is denoted on the x-axis labels.
20. Boender LGM, Almering MJH, Dijk M, van Maris AJA, de Winde JH, Pronk JT, and Daran-Lapujade P (2011). Extreme calorie restriction and energy source starvation in Saccharomyces cerevisiae represent distinct physiological states. BBA-Mol Cell Res 1813(12): 2133-2144. http://dx.doi.org/10.1016/j.bbamcr.2011.07.008