
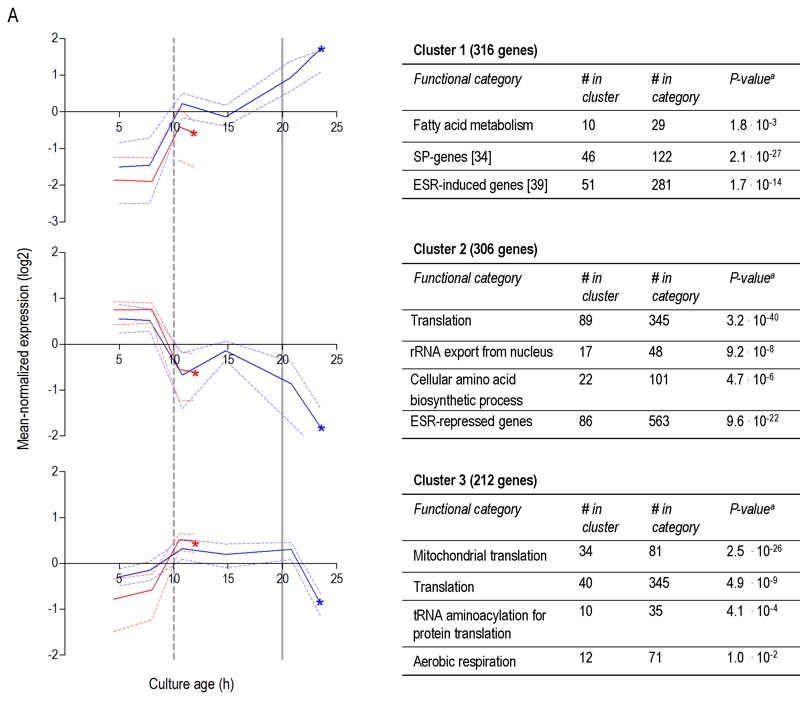
FIGURE 6A: Clustering of genes differentially expressed between aerobic and anaerobic SP cultures according to their expression profiles during the growth phases preceding SP.
Genes whose differential expression between aerobic and anaerobic SP cultures originated from changes after glucose depletion (A). Each graph presents the expression profiles of genes from aerobic culture (blue lines) and anaerobic cultures (red lines) in a particular gene cluster. The solid lines represent the average of the mean-normalized expression of all genes in the cluster. The dashed lines represent the first and third quartile of these mean-normalized expression values, giving information on the scatter in the expression of genes in the cluster. Asterisks (*) indicate the SP samples from anaerobic and aerobic batches. Vertical lines indicate glucose exhaustion (dashed line) and carbon exhaustion (solid line, for aerobic cultures only). For each cluster a table reports the overrepresentation of functional categories, including the number of genes in the cluster belonging to a specific functional category (# in cluster), the total number of genes in this functional category (# in category), and the aBonferroni-corrected P-values that indicate the likelihood of obtaining such enrichment in a random set of genes. Only categories with aBonferroni-corrected P-value below 0.05 were deemed significant and presented in the tables. More details can be found in Supplemental Table S3.
Go to Figure 6B.