
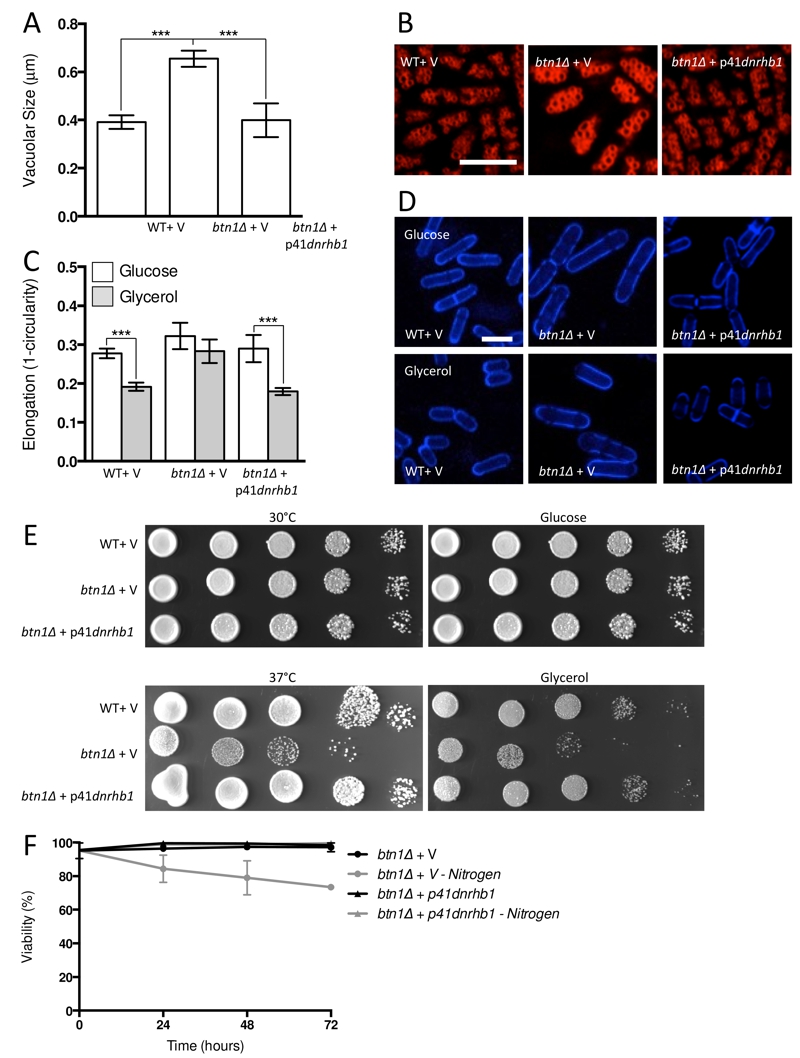
FIGURE 5: Inhibiting TORC1 function rescues the defects in btn1Δ cells.
(A) Cells lacking btn1 were transformed with an expression vector containing a dominant-negative form of rhb1 (dnrhb1). Vacuole size was measured in these cells, in addition to wild-type (WT) and btn1Δ cells containing empty vector, following staining with the vital dye FM4-64. The diameter of 300 vacuoles was measured per data set, and data shown is a mean (± SEM) of 4 independent experiments. Statistical analysis was performed using a one-way ANOVA with a Tukey’s multiple comparison post-test (*** = P < 0.001).
(B) Representative images of experiments as performed in (A) shown. Scale bar represents 10 μm.
(C) The morphological response of these populations to growth on glycerol was analysed following 6 hours in culture using a measure of cell elongation, on a scale of 0 to 1, where 0 represents a perfectly round cell (1-(4π*area/perimeter2)). Data shown is a mean (± SEM) of 5 independent experiments. Statistical significance between each condition was determined using a one-way ANOVA with a Tukey’s multiple comparison post-test (*** = P < 0.001).
(D) Representative images of experiments as performed in (C) shown. Scale bar represents 10 μm.
(E) These cells were serially diluted from a log-phase culture (1 x 10⁶ cells/ml) and spotted onto YES plates. Plates were then incubated at 30°C or 37°C for 3-4 days to determine growth at high temperature. They were also spotted onto plates containing either glucose or glycerol as a carbon source. Plates were then incubated at 30°C for 6-7 days to determine growth under non-fermentative conditions. Images are representative of three independent experiments.
(F) Viability upon nitrogen limitation was determined over periods of up to 72 hours in these cell populations, using propidium iodide to stain dead cells and calcofluor white to stain all cells. Cells were cultured in either MM or MM lacking a nitrogen source (NH4Cl). 500 cells were scored for viability per data set, and data shown is a mean (± SEM) of 3 independent experiments. Scale bar represents 10 μm.