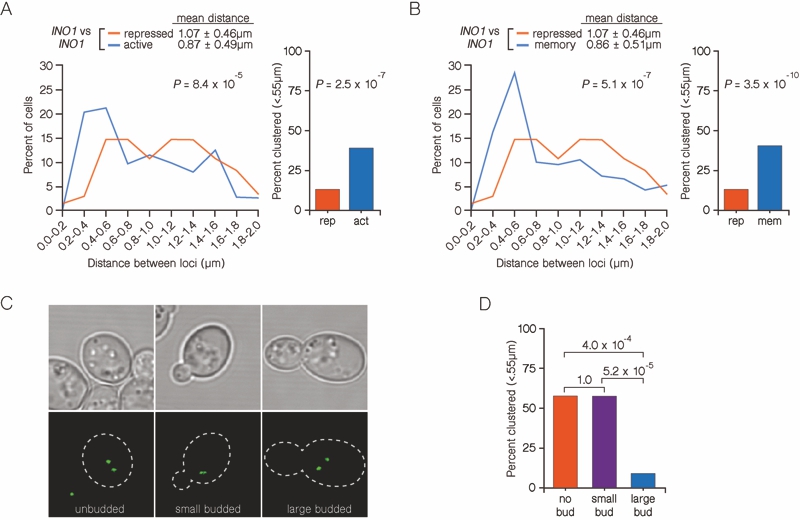
FIGURE 6: Interchromosomal clustering of recently repressed INO1 is regulated through the cell cycle.
(A and B) An asynchronous population of cells having INO1:TetO and INO1:LacO, expressing GFP-TetR, GFP-LacI and Pho88-mCherry (ER/nuclear envelope membrane protein) were grown under repressing, activating or memory conditions. Left: The distribution of distances between the two loci in ~ 100 cells, binned into 0.2 µm bins. P values were calculated using a Wilcoxon Rank Sum Test. Right: the fraction of cells in which the two loci were ≤ 0.55 µm. P values were calculated using a Fisher Exact Test.
(C) Bright field (top) and green fluorescence (bottom) channels of typical cells used to measure distances in cells with different bud morphologies. The outline of the cell above is overlaid on the green channel (hatched line).
(D) Cells were scored for both their bud morphology and the distance between the two loci and the fraction of each class of cells that was ≤ 0.55 µm was determined. P values were calculated using the Fisher Exact Test.

