
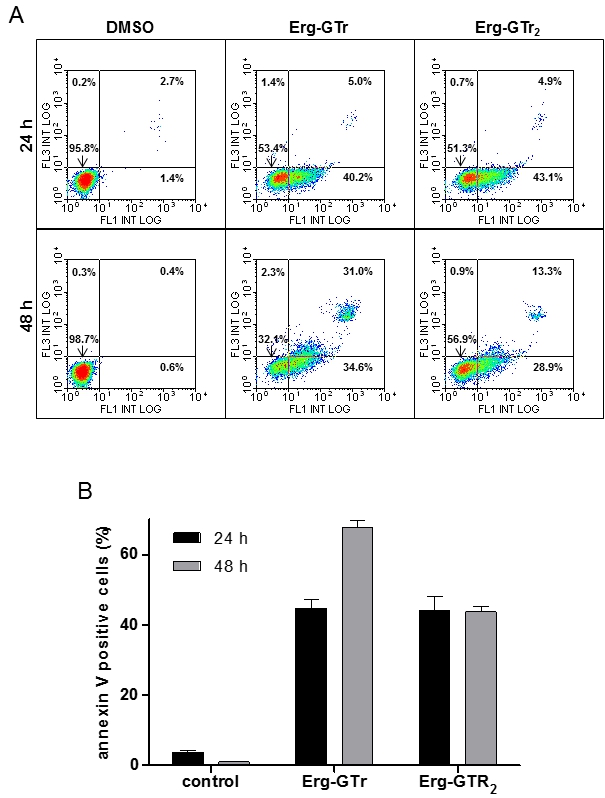
FIGURE 2: Phosphatidylserine exposure after Erg-GTr treatment.
(A) Double staining propidium iodide (PI) and Annexin V-Alexa 488 from parasites after 24 and 48 hours treatment; left column control cells, middle and right column experimental cells. The dot plots represent the results of a typical experiment.
(B) Total population in percentage exposing phosphatidylserine after the indicated time. Bars show the mean +/- SD of at least three independent experiments. The percentages were determined using the WinMDI software.