
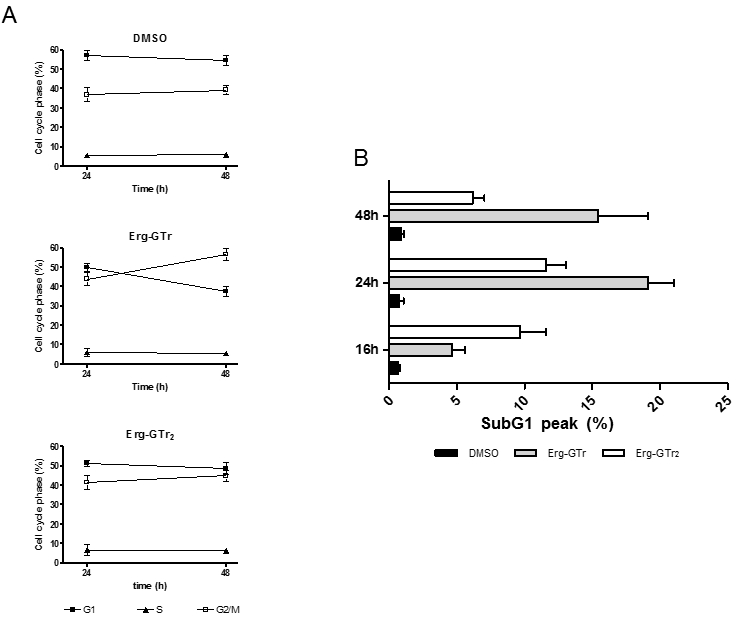
FIGURE 4: Analysis of the DNA content in L. mexicana promastigotes. Treated (1.4 μM Erg-GTr or 2.3 μM Erg-GTr2) or control cells (DMSO) were harvested at different time points and prepared for determination of DNA content. Acquisition was performed in arithmetic scale to obtain G1 and G2/M peaks and in logarithmic scale to earn the subG1 peak.
(A) Percentage of cells in the different phases of the cell cycle after 24 and 48 hours treatment.
(B) SubG1 peak in percentage after 16, 24 and 48 hours drug contact. Quantification was carried out using the WinMDI software. The bars represent the mean+/-S.D. of three individual cultures measured at each time point.