
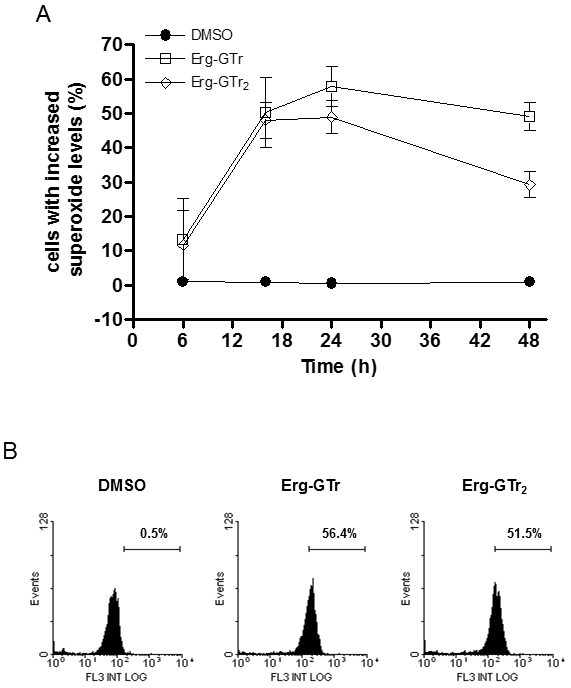
FIGURE 6: Superoxide production after Erg-GTr or Erg-GTr2 treatment. Parasites were treated with 1.4 μM Erg-GTr or 2.3 μM Erg-GTr2 or DMSO (control cells), harvested after different time points and then prepared to measure intracellular superoxide using dyhidroethidium.
(A) Superoxide production kinetics in control and treated parasites. Results represent mean +/- SD of three independent experiments.
(B) Representative FACS histograms showing the superoxide-sensitive fluorescence of control and treated promastigotes after 24 hours incubation. The percentages were determined using the WinMDI software.