
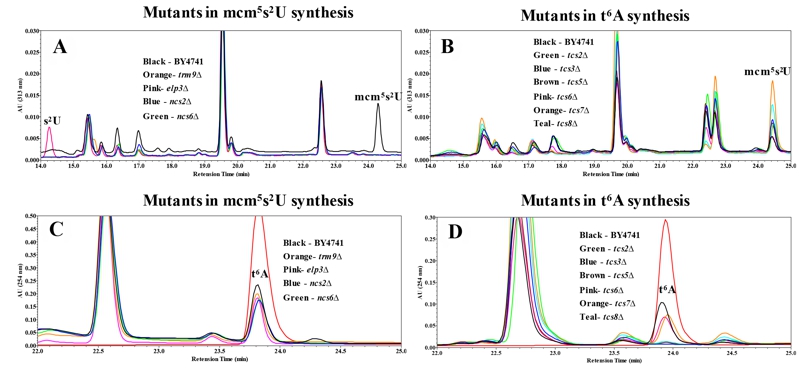
FIGURE 2: HPLC analysis examining the relationship between mcm5s2U34 and t6A37.
(A) Analysis of mutations in mcm5s2U synthesis with detection at 313 nm specific for thio-moieties. Black line = BY4741; Orange = trm9∆; Pink = elp3∆; Blue = ncs2∆; Green = ncs6∆.
(B) Analysis of mcm5s2U in mutants for t6A synthesis for with detection at 313 nm. Black = BY4741; Green = tcs2∆; Blue = tcs3∆; Brown = tcs5∆; Pink = tcs6∆; Orange = tcs7∆; Teal = tcs8∆.
(C) Analysis for t6A in mutants of mcm5s2U synthesis with detection at 254 nm. The color scheme is the same as part A, with the t6A standard in red.
(D) Analysis for t6A in mutants of t6A synthesis with detection at 254 nm. Color scheme is the same as part B, with the t6A standard in red.